github.com/sitespeedio/sitespeed.io @v41.4.1 sqlite
README
sitespeed.io
![]()
![]()
![]()
![]()
![]()
![]()
![]()


![]()
Website | Documentation | Changelog | Bluesky | Mastodon
Table of Contents
- What is sitespeed.io?
- Documentation
- Installation
- Docker
- NodeJS
- Usage
- Basic usage
- Advanced configuration
- Mobile testing
- Examples
- Contributing
- Reporting issues
- Community
- License
What is sitespeed.io?
sitespeed.io is an Open Source web performance tool. Run it once to debug a slow page and you get an HTML report with Core Web Vitals, a video of the page loading, the HAR waterfall and the Coach's advice on how to fix what's slow. Run it every hour against your site, ship the metrics to Graphite or InfluxDB, and you have a Grafana dashboard tracking your site's performance over time.
It's been around since 2012, it's free, you own all your data, and there's nothing to sign up for.
sitespeed.io drives a real browser — Firefox, Chrome, Edge, or Safari (including Safari on a real iPhone over USB) — to load your page, then collects:
- Core Web Vitals — LCP, INP, CLS, TTFB and FCP, scored against Google's p75 thresholds.
- A video and visual metrics — First Visual Change, Speed Index, Last Visual Change, plus a scrubable filmstrip.
- The HAR waterfall — rendered with waterfall-tools.
- The Coach's advice — a checklist of best-practice rules with severity, scores and concrete fixes.
- CPU and long-task analysis — what the main thread was doing during the load.
Three common ways to use it:
- Audit a page from your terminal. Run
sitespeed.io https://example.com, open the HTML report, see what's slow. - CI regression testing. Run on every PR, fail the build if a budget is exceeded.
- Production monitoring. Run on a schedule, ship metrics to Graphite or InfluxDB, watch your site over time in Grafana.
Documentation
The full guide lives at sitespeed.io/documentation — installation, configuration, scripting, monitoring, and a walkthrough of every metric we collect.
Installation
Docker
Easiest way to run sitespeed.io — the Docker image ships with Firefox, Chrome, Edge and the dependencies you need:
docker run --rm -v "$(pwd)":/sitespeed.io sitespeedio/sitespeed.io https://www.sitespeed.io/
The -v flag mounts the current directory so the test results land somewhere you can find them.
NodeJS
If you'd rather install via npm:
npm i -g sitespeed.io
Then test a URL:
sitespeed.io https://www.example.com
You'll need a browser installed locally (Firefox / Chrome / Edge / Safari), plus FFmpeg and Python if you want video and visual metrics. See the installation guide for the full list.
Usage
Basic usage
Pass a URL and sitespeed.io will load it. Add -n 5 to run five iterations and report the median (recommended for any real measurement — single runs are noisy):
sitespeed.io https://www.example.com --browser chrome -n 5
Advanced configuration
Lots of flags. --help shows them all:
sitespeed.io --help
See the configuration documentation for the long form.
Mobile testing
Real Android phones over USB:
sitespeed.io https://www.example.com --android
Real iPhones over USB (new in 40.0):
sitespeed.io https://www.example.com -b safari --safari.ios
Examples
Summary report
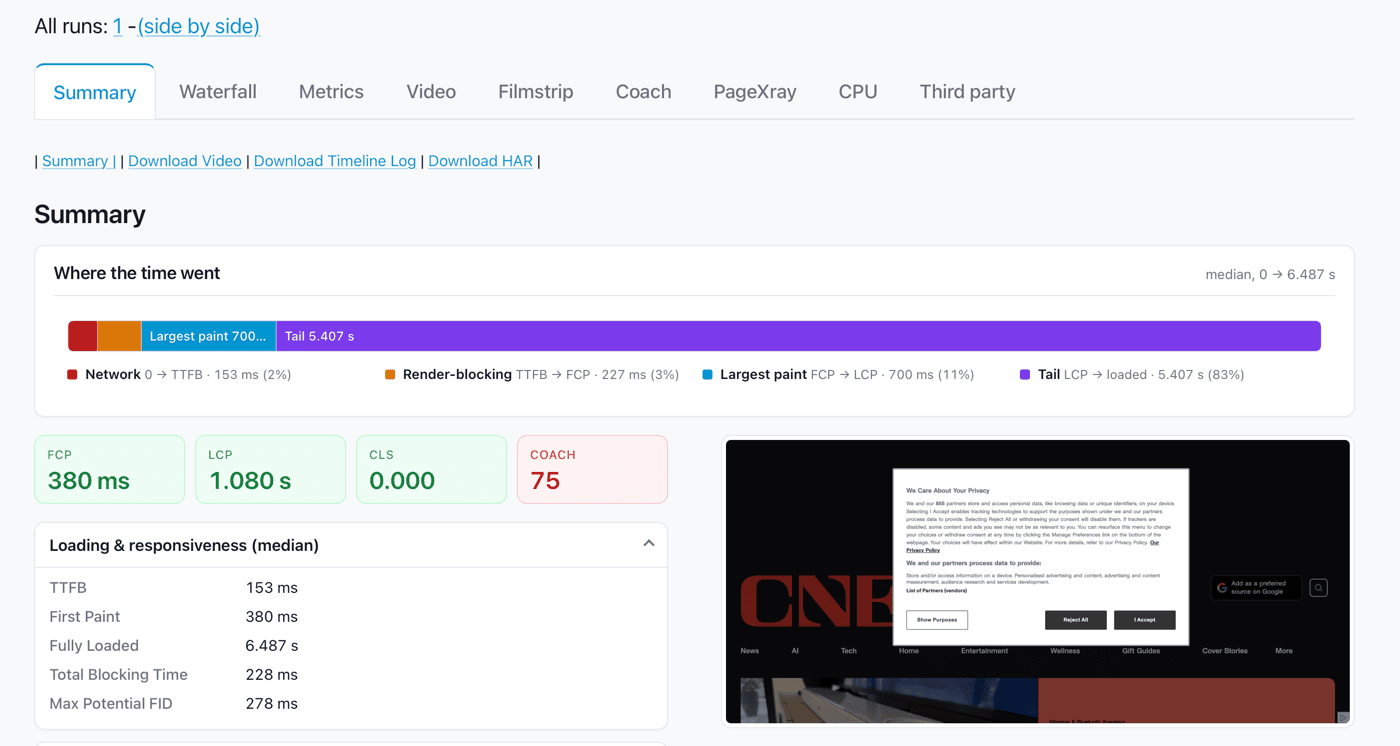
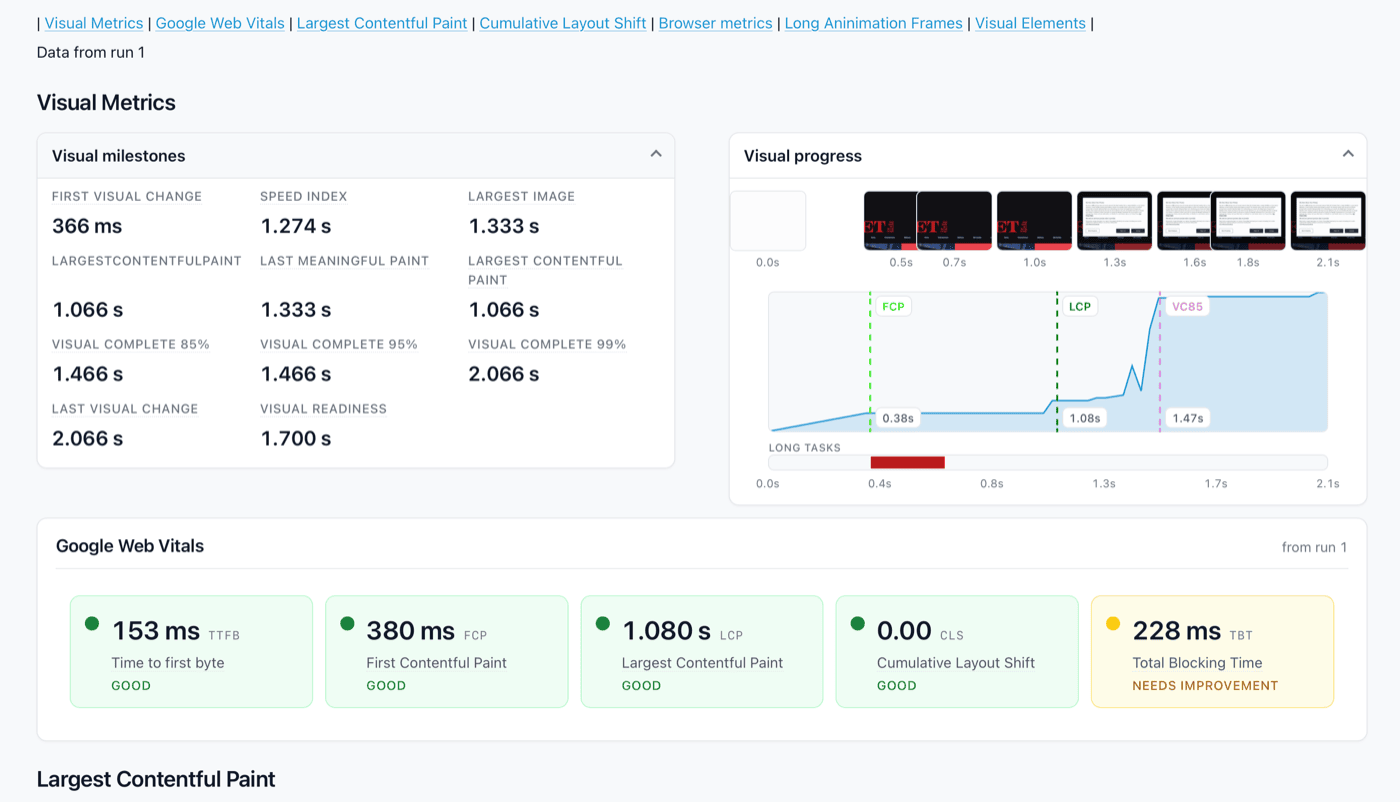
Per-URL report
Continuous monitoring in Grafana
Live setup at dashboard.sitespeed.io — sitespeed.io feeding Graphite, visualised with Grafana.

Trends over time:

Video
Video of the page loading, captured with --video --visualMetrics:
Contributing
We'd love your help — code, docs, design, bug reports, or just letting us know what's missing. Open an issue first if you want to discuss, then fork, branch and submit a PR. The full guide is in CONTRIBUTING.md.
Reporting issues
Bugs and feature requests go on GitHub Issues. Search first to avoid duplicates.
Community
- Slack — join our workspace.
- GitHub Issues — github.com/sitespeedio/sitespeed.io/issues for bugs and feature requests.
- RSS — release feed for new versions.
License
Core symbols most depended-on inside this repo
eShape
Languages
Modules by API surface
Dependencies from manifests, versioned
For agents
$ claude mcp add sitespeed.io \
  -- python -m otcore.mcp_server <graph>