hub / github.com/xiaolin3303/wx-charts
github.com/xiaolin3303/wx-charts @main sqlite
61 symbols
158 edges
16 files
0 documented · 0%
README
wx-charts
微信小程序图表工具,charts for WeChat small app
基于canvas绘制,体积小巧
持续优化更新中,请保持关注~ 有任何问题欢迎在Issues中讨论,提出issue前请先阅读此须知
字节跳动大量招聘前端开发工程师(初级、高级、资深、Leader),坐标北京、上海、深圳、杭州、成都、武汉、广州、南京,感兴趣的朋友请点击此处进行投递
支持图表类型
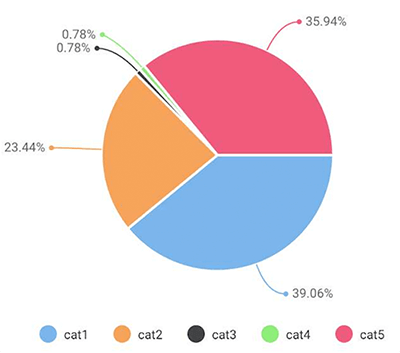
- 饼图
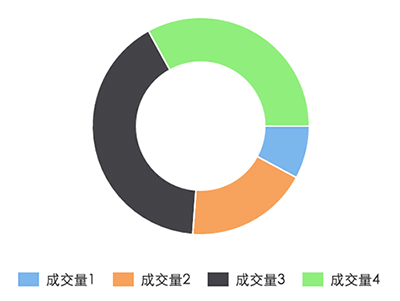
pie - 圆环图
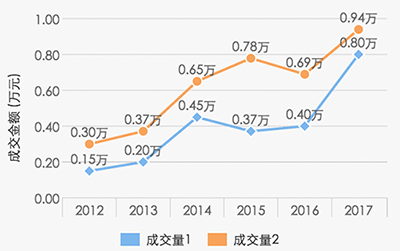
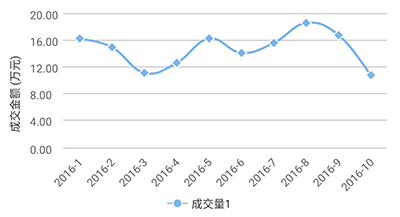
ring - 线图
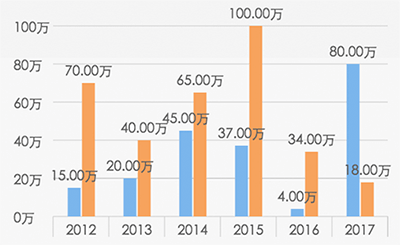
line - 柱状图
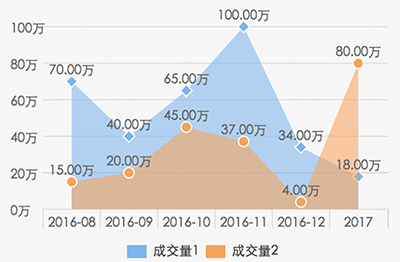
column - 区域图
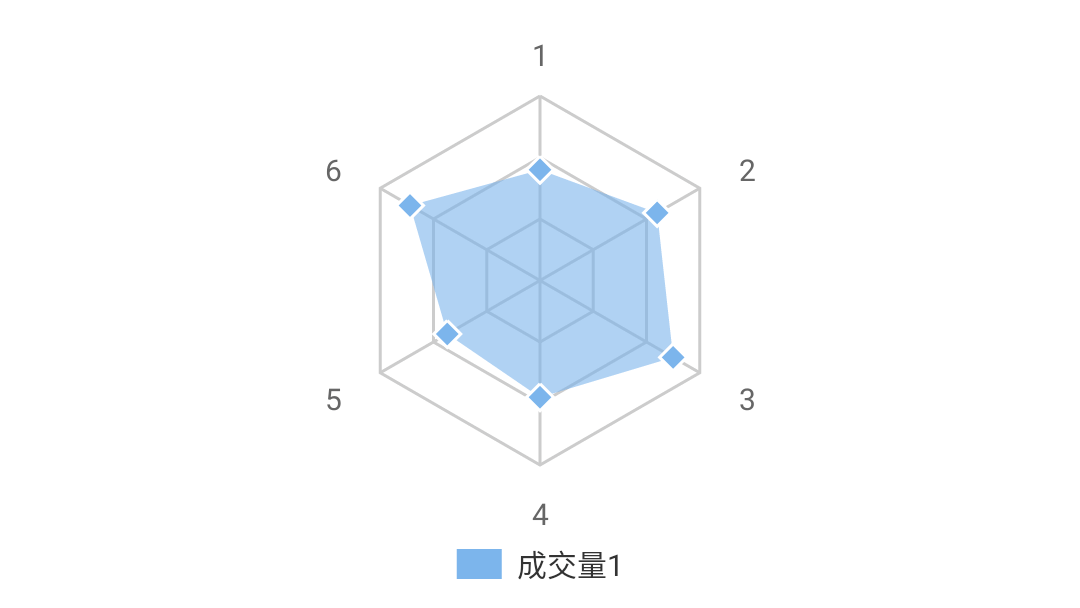
area - 雷达图
radar
代码分析 Here
更新记录
- [ ] 动画性能优化
- [x] 图表滚动的支持,感谢@jxintang
- [x] 优化曲线绘制
- [x] 新增雷达图 2017-03-17
- [x] 新增tooltip 2017-03-07
- [x] 新增曲线的绘制 2017-03-06
- [x] 新增更新数据、终止进行中的动画方法,渲染完成事件回调 2017-02-17
- [x] 新增圆环图title, subtitle 2017-01-10
- [x] x轴文案碰撞避让 2016-12-30
- [x] add pie chart dataLabel 2016-12-19
- [x] add animation 2016-12-05
- [x] build with
rollup2016-12-02 - [x] add legend 2016-11-29
如何使用
1、直接引用编译好的文件 dist/wxcharts.js 或者 dist/wxcharts-min.js
2、自行编译
git clone https://github.com/xiaolin3303/wx-charts.git
npm install rollup -g
npm install
rollup -c 或者 rollup --config rollup.config.prod.js
实际项目中如何具体使用wx-charts 或者 访问wx-charts-demo查看在微信开发工具中直接运行的例子
参数说明
方法 & 事件
Example


更多内容请查看Example - wxCharts使用说明
测试
- iPhone 6s, IOS 9.3.5
- 小米4, ANDORID 6.0.1
兼容性问题请在Issue中提出
一些问题的说明汇总
Core symbols most depended-on inside this repo
measureTextcalled by 17
src/components/charts-util.js
convertCoordinateOrigin
called by 7
src/components/charts-util.js
getDataPoints
called by 6
src/components/charts-data.js
assign
called by 6
src/util/polyfill/index.js
getXAxisPoints
called by 5
src/components/charts-data.js
calYAxisData
called by 5
src/components/charts-data.js
drawLegend
called by 5
src/components/draw.js
drawCanvas
called by 5
src/components/draw.js
Shape
Languages
TypeScript100%
Modules by API surface
src/components/charts-data.js23 symbols
src/components/draw.js12 symbols
src/components/charts-util.js12 symbols
src/components/draw-data-text.js4 symbols
src/components/animation.js3 symbols
src/components/draw-tooltip.js2 symbols
src/util/polyfill/index.js1 symbols
src/util/event.js1 symbols
src/components/draw-data-shape.js1 symbols
src/components/draw-charts.js1 symbols
src/app.js1 symbols
Dependencies from manifests, versioned
babel-plugin-external-helpers6.18.0 · 1×
babel-preset-es20156.18.0 · 1×
rollup-plugin-babel2.6.1 · 1×
rollup-plugin-uglify1.0.1 · 1×
For agents
$ claude mcp add wx-charts \
  -- python -m otcore.mcp_server <graph>