github.com/nhn/tui.chart @v4.6.1 sqlite
README

🍞📈 Spread your data on TOAST UI Chart. TOAST UI Chart is Beautiful Statistical Data Visualization library.


![]()
![]()
![]()
📦 Packages
The functionality of TOAST UI Chart is available when using the Plain JavaScript, React, Vue Component.
- toast-ui.chart - Plain JavaScript component implemented by NHN Cloud.
- toast-ui.vue-chart - Vue wrapper component implemented by NHN Cloud.
- toast-ui.react-chart - React wrapper component implemented by NHN Cloud.
📙 Documents
😍 Why TOAST UI Chart?
Simple, Easy to Use, And It's Beautiful!
TOAST UI Chart makes your data pop and presents it in a manner that is easy to understand. Furthermore, it provides a wide range of theme options for customizing the charts to be suitable for all of your services. Chart components like the title, axes, legends, tooltips, plots, series, and more can be customized through the options.

Variety of powerful features!
Responsive
Add different options and animations according to the charts' sizes by using the responsive option.

Zoomable
Make the data presented in the Line, Area, and Treemap Charts zoomable with the zoomable option.

Live Update
View and manage new data as they are added realtime with the addData API and the options.series.shift option.
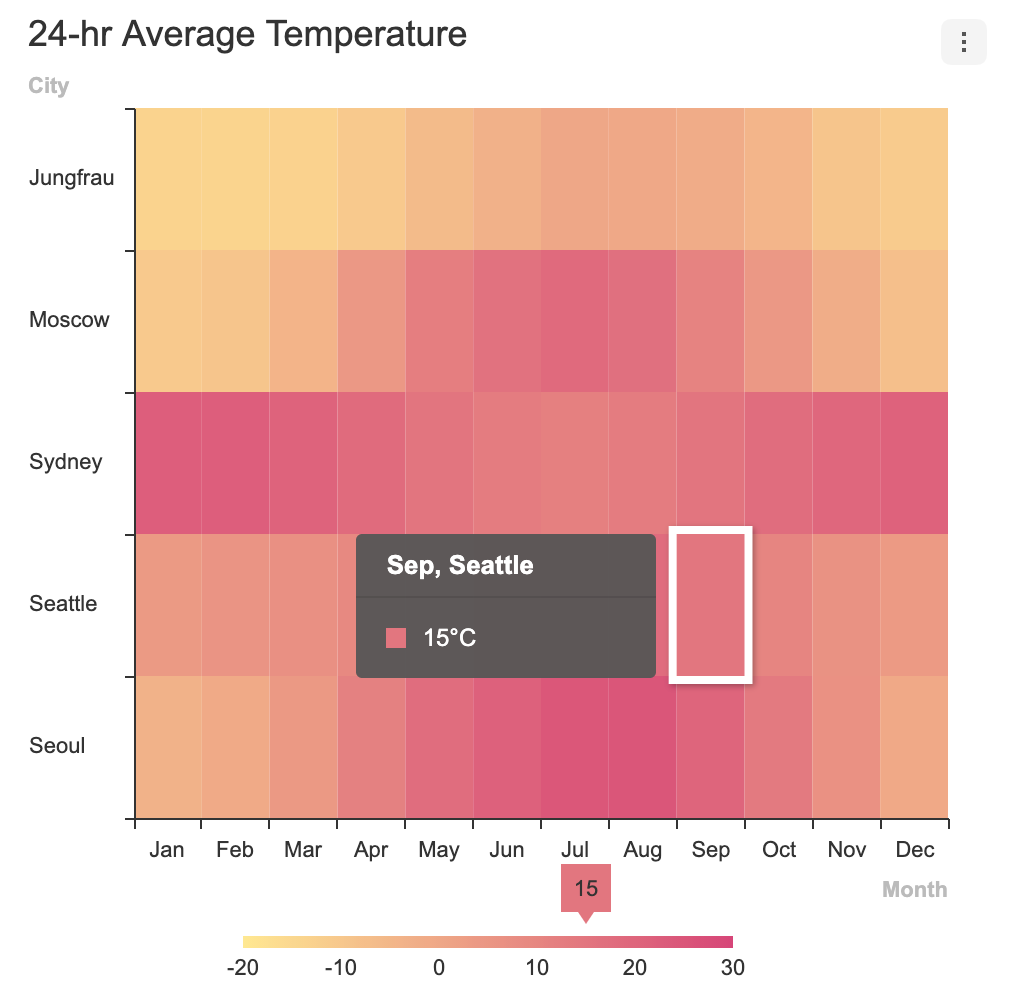
| Area | Line | Heatmap |
|---|---|---|
 |
 |
 |
| LineArea | Column | ColumnLine |
|---|---|---|
 |
 |
 |
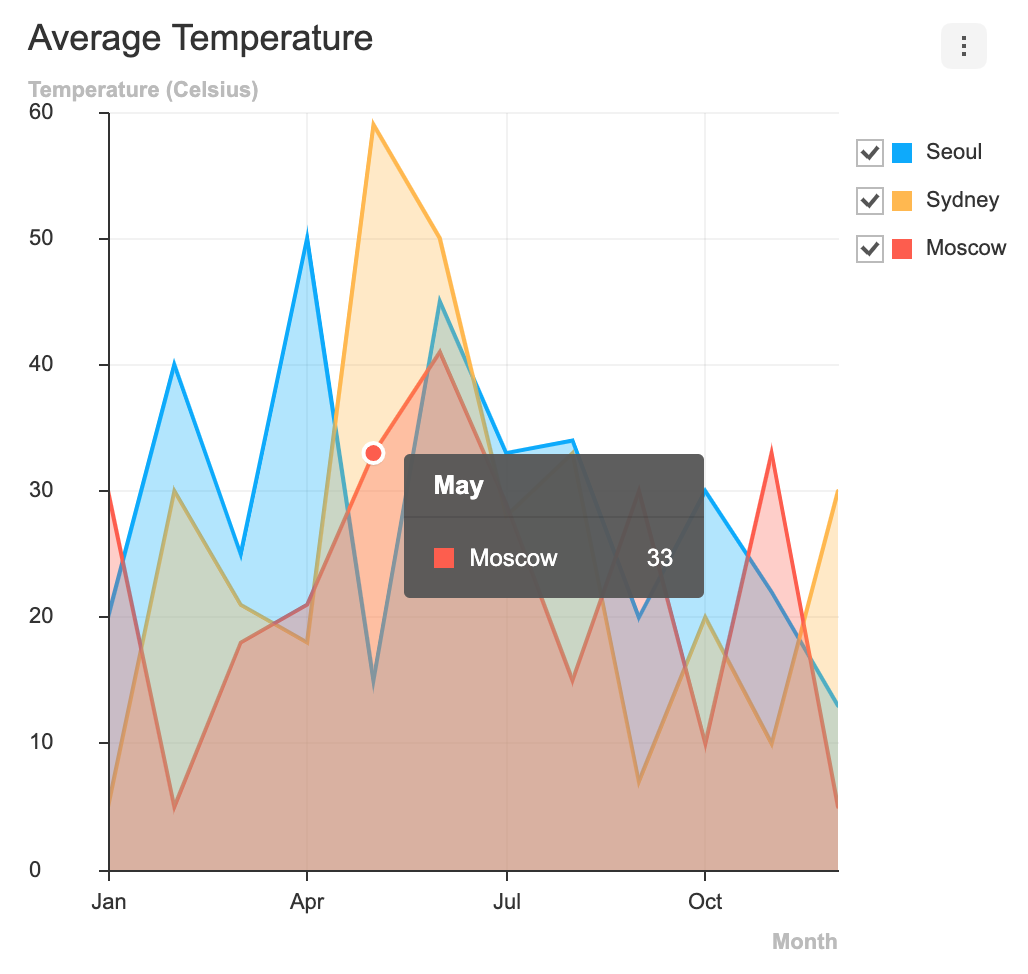
Synchronize Tooltip
Use and synchronize the tooltip features at the moment the cursor hovers over the chart with the showTooltip API and the on custom event.
🎨 Features
Charts
The TOAST UI Chart provides many types of charts to visualize the various forms of data.
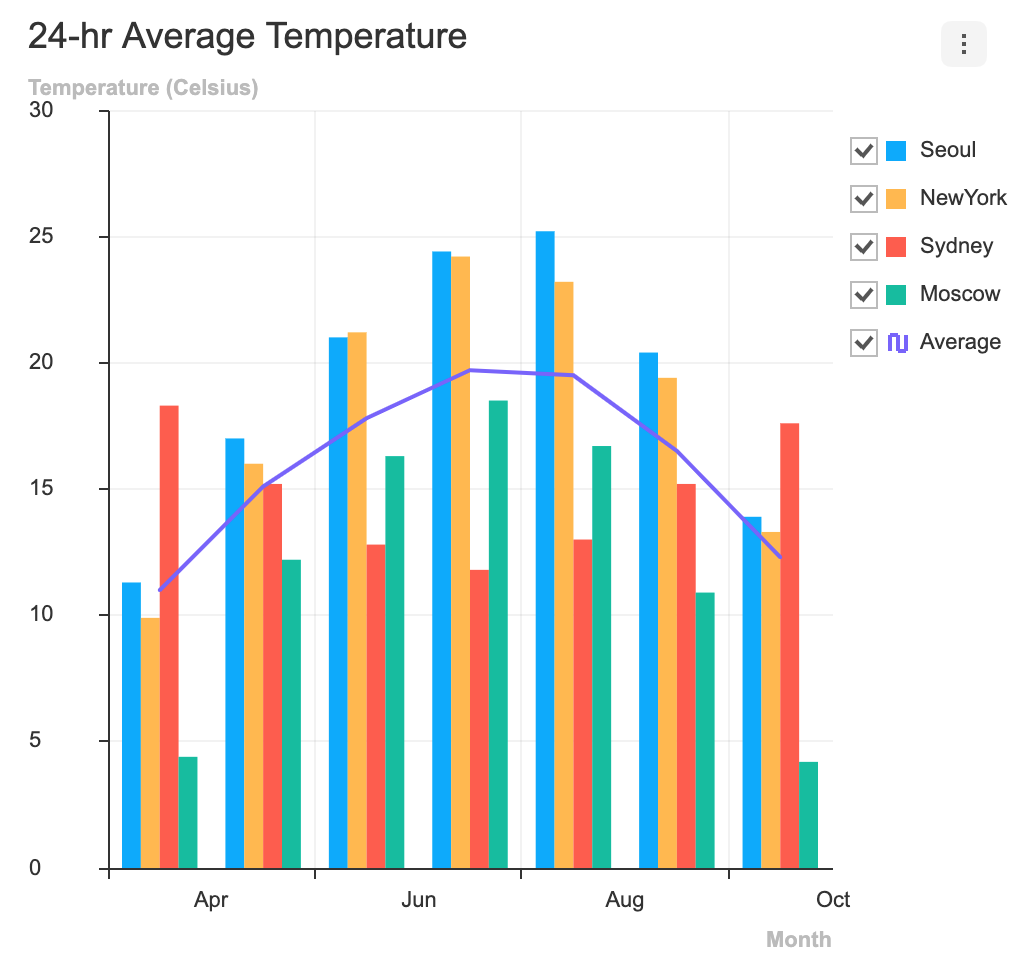
| Area | Line | Bar | Column |
|---|---|---|---|
 |
 |
 |
 |
| Bullet | BoxPlot | Treemap | Heatmap |
|---|---|---|---|
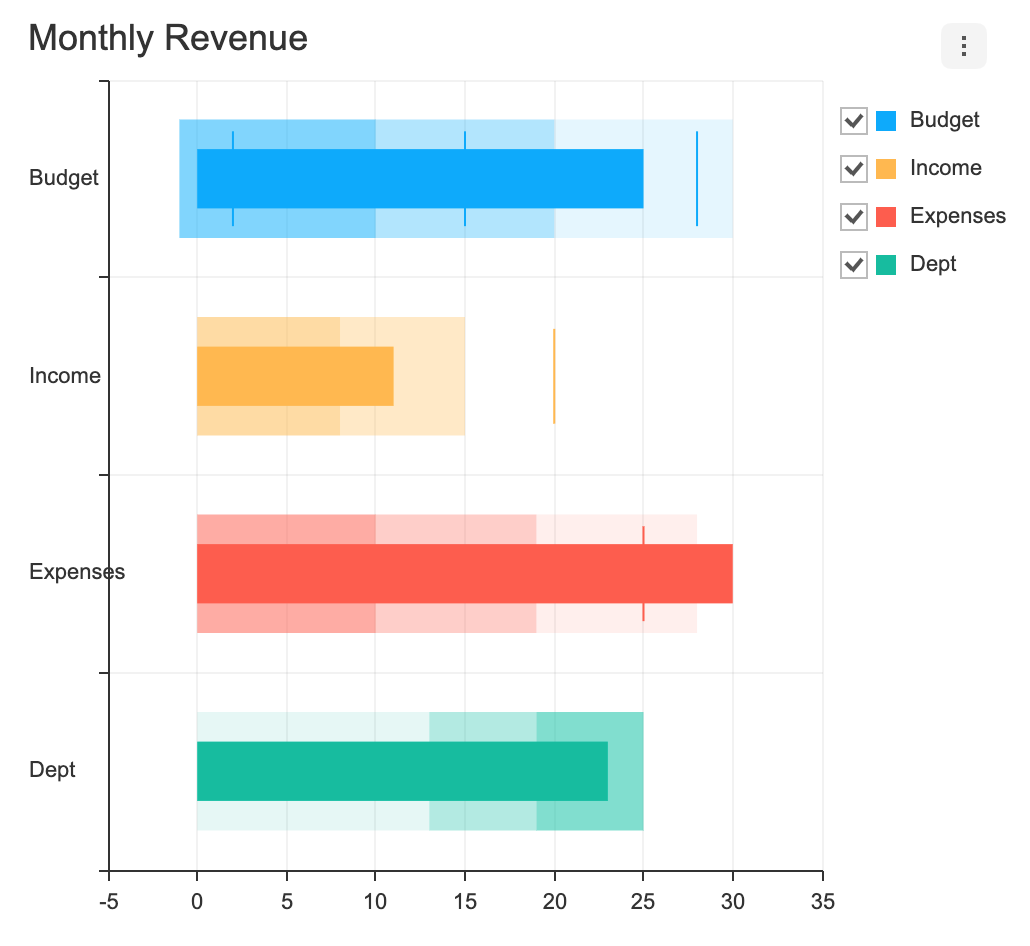 |
 |
 |
 |
| Scatter | Bubble | Radar | Pie |
|---|---|---|---|
 |
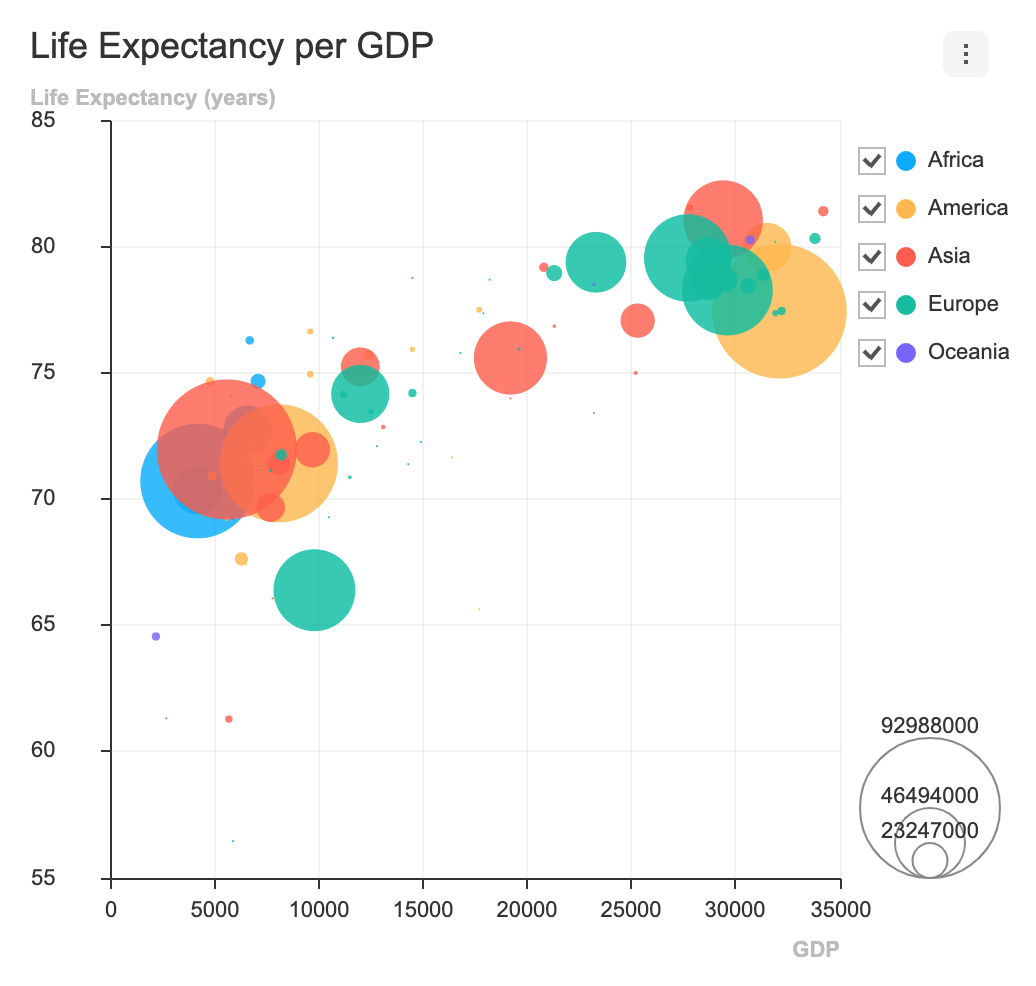 |
 |
 |
| LineArea | LineScatter | ColumnLine | NestedPie |
|---|---|---|---|
 |
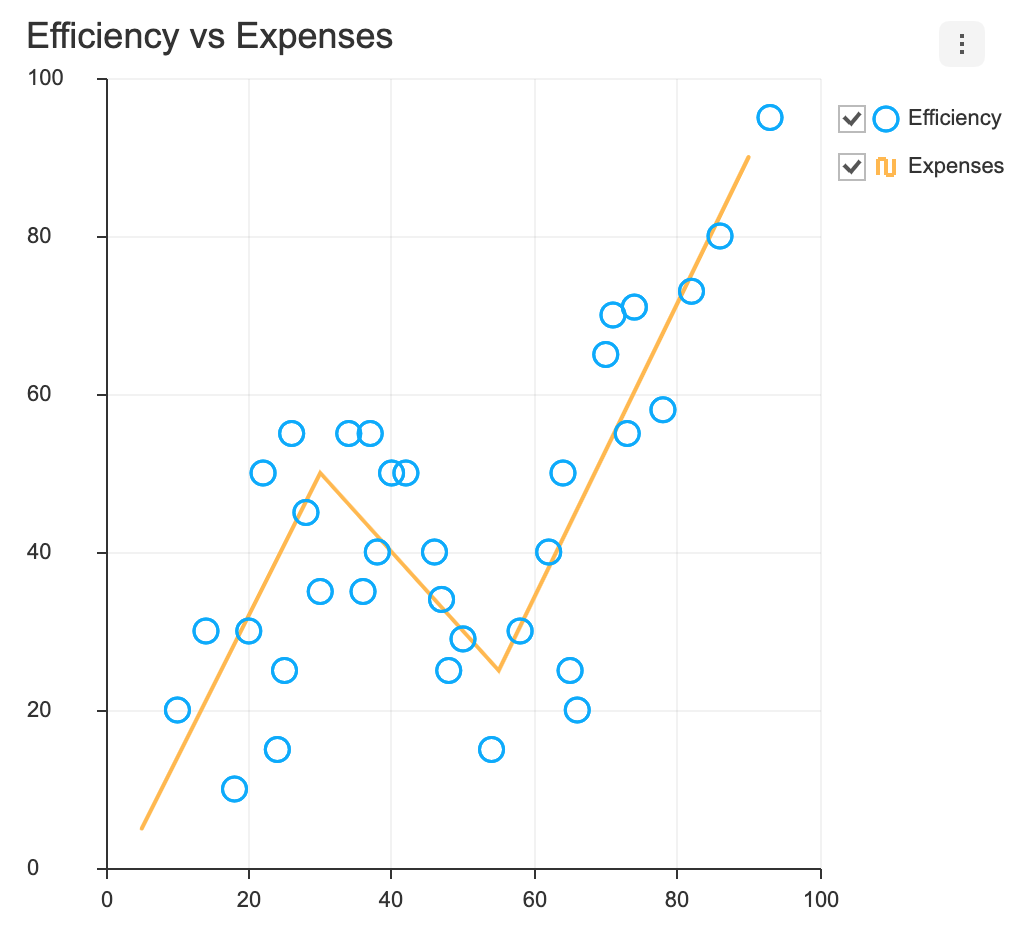 |
 |
 |
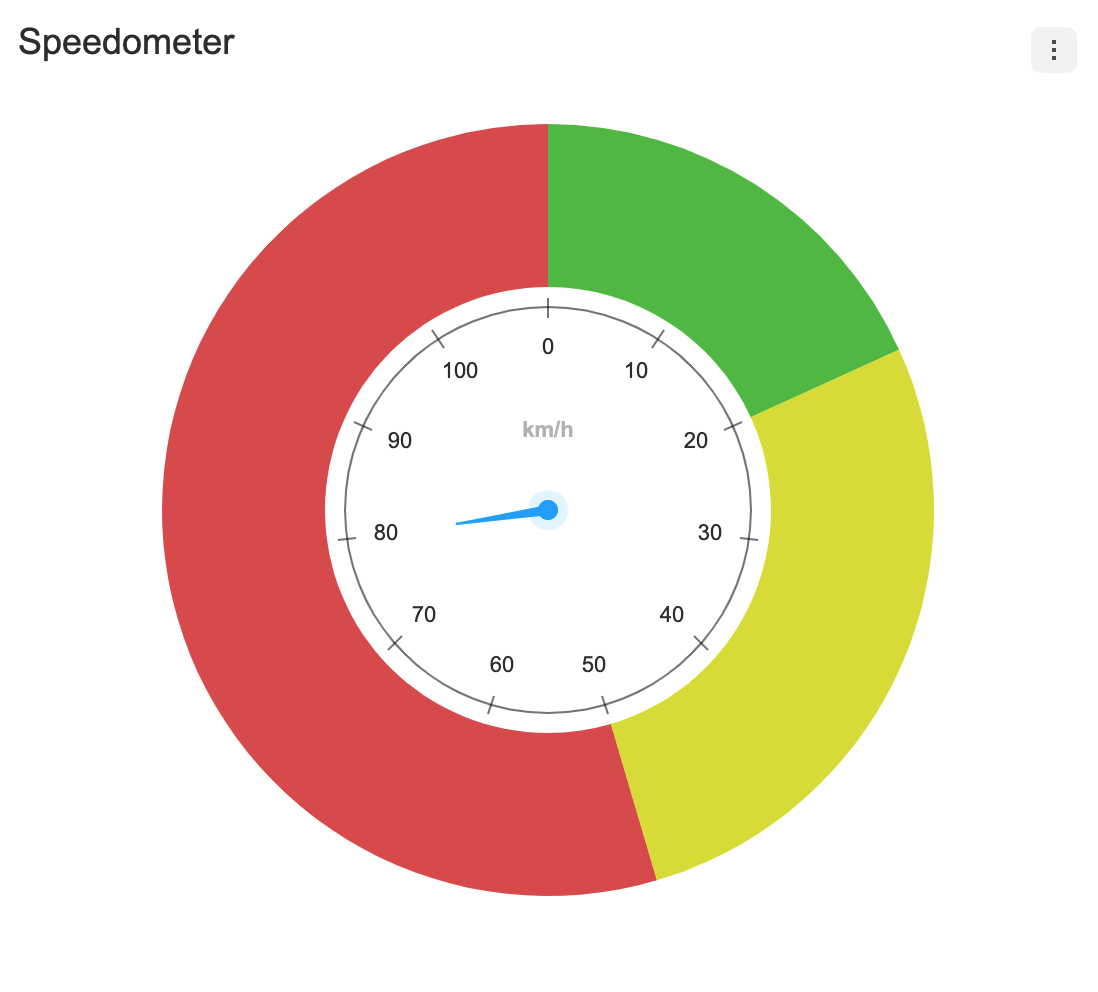
| RadialBar | Gauge | ||
|---|---|---|---|
 |
 |
 |
|
- Stack Options(Explained in each chart guide)
- Diverging Options(Explained in each chart guide)
- Change Event Detect Type(Explained in each chart guide)
- Custom Theme
- Custom Tooltip
- Export
xls,csv,png,jpegfile - Live Update
- Responsive Layout
In addition, a variety of powerful features can b
Extension points exported contracts — how you extend this code
ResizeObserverOptions (Interface)Core symbols most depended-on inside this repo
addShape
Languages
Modules by API surface
Dependencies from manifests, versioned
For agents
$ claude mcp add tui.chart \
  -- python -m otcore.mcp_server <graph>