github.com/kalkih/mini-graph-card @v0.13.0 sqlite
README
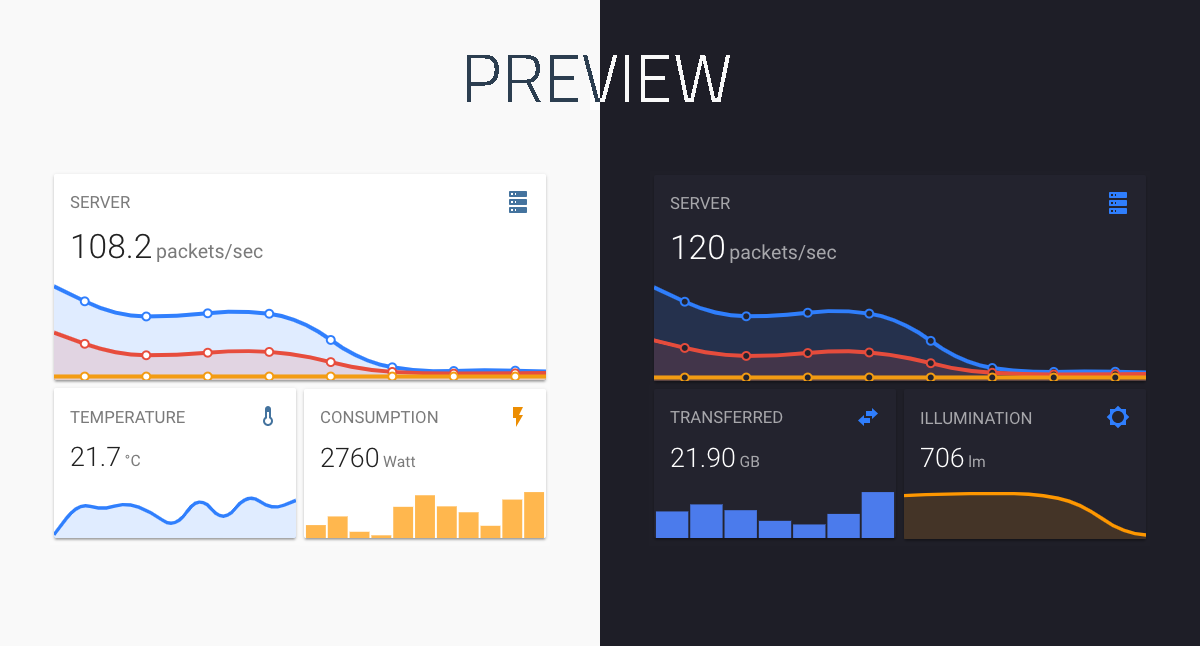
Lovelace Mini Graph Card
A minimalistic and customizable graph card for Home Assistant Lovelace UI.
The card works with entities from within the sensor & binary_sensor domain and displays the sensors current state as well as a line graph representation of the history.
Install
HACS (recommended)
This card is available in HACS (Home Assistant Community Store).
HACS is a third party community store and is not included in Home Assistant out of the box.

Manual install
-
Download and copy
mini-graph-card-bundle.jsfrom the latest release into yourconfig/wwwdirectory. -
Add the resource reference as decribed below.
CLI install
-
Move into your
config/wwwdirectory. -
Grab
mini-graph-card-bundle.js:
console
  $ wget https://github.com/kalkih/mini-graph-card/releases/download/v0.13.0/mini-graph-card-bundle.js
- Add the resource reference as decribed below.
Add resource reference
If you configure Lovelace via YAML, add a reference to mini-graph-card-bundle.js inside your configuration.yaml:
yaml
  resources:
    - url: /local/mini-graph-card-bundle.js?v=0.13.0
      type: module
Else, if you prefer the graphical editor, use the menu to add the resource:
- Make sure, advanced mode is enabled in your user profile (click on your user name to get there)
- Navigate to Configuration -> Lovelace Dashboards -> Resources Tab. Hit orange (+) icon
- Enter URL
/local/mini-graph-card-bundle.jsand select type "JavaScript Module". (Use/hacsfiles/mini-graph-card/mini-graph-card-bundle.jsand select "JavaScript Module" for HACS install) - Restart Home Assistant.
Updating
If you have a version older than v0.0.8 installed, please delete the current files and follow the installation instructions again.
-
Find your
mini-graph-card-bundle.jsfile inconfig/wwwor wherever you ended up storing it. -
Replace the local file with the latest one attached in the latest release.
-
Add the new version number to the end of the cards reference url in your
ui-lovelace.yamllike below:
yaml
  resources:
    - url: /local/mini-graph-card-bundle.js?v=0.13.0
      type: module
You may need to empty the browsers cache if you have problems loading the updated card.
Using the card
We recommend looking at the Example usage section to understand the basics to configure this card. (also) pay attention to the required options mentioned below.
Options
Card options
| Name | Type | Default | Since | Description |
|---|---|---|---|---|
| type (required) | string | v0.0.1 | custom:mini-graph-card. |
|
| entities (required) | list | v0.2.0 | One or more sensor entities in a list, see entities object for additional entity options. | |
| icon | string | v0.0.1 | Set a custom icon from any of the available mdi icons. | |
| icon_image | string | v0.12.0 | Override icon with an image url | |
| name | string | v0.0.1 | Set a custom name which is displayed beside the icon. | |
| unit | string | v0.0.1 | Set a custom unit of measurement ('' value for an empty unit). |
|
| tap_action | action object | v0.7.0 | Action on click/tap. | |
| group | boolean | false |
v0.2.0 | Disable paddings and box-shadow, useful when nesting the card. |
| hours_to_show | integer | 24 |
v0.0.2 | Specify how many hours of history the graph should present. |
| points_per_hour | number | 0.5 |
v0.2.0 | Specify amount of data points the graph should display for each hour, (basically the detail/accuracy/smoothing of the graph). |
| aggregate_func | string | avg |
v0.8.0 | Specify aggregate function used to calculate point/bar in the graph. |
| group_by | string | interval |
v0.8.0 | Specify type of grouping of data, dynamic interval, date or hour. |
| update_interval | number | v0.4.0 | Specify a custom update interval of the history data (in seconds), instead of on every state change. | |
| cache | boolean | true |
v0.9.0 | Enable/disable local caching of history data. |
| show | list | v0.2.0 | List of UI elements to display/hide, for available items see available show options. | |
| animate | boolean | false |
v0.2.0 | Add a reveal animation to the graph. |
| height | number | 150 |
v0.0.1 | Set a custom height of the line graph. |
| bar_spacing | number | 4 |
v0.9.0 | Set the spacing between bars in bar graph. |
| line_width | number | 5 |
v0.0.1 | Set the thickness of the line. |
| line_color | string/list | var(--accent-color) |
v0.0.1 | Set a custom color for the graph line, provide a list of colors for multiple graph entries. |
| color_thresholds | list | v0.2.3 | Set thresholds for dynamic graph colors, see Line color object. | |
| color_thresholds_transition | string | smooth |
v0.4.3 | Color threshold transition, smooth or hard. |
| decimals | integer | v0.0.9 | Specify the exact number of decimals to show for states. | |
| hour24 | boolean | false |
v0.2.1 | Set to true to display times in 24-hour format. |
| font_size | number | 100 |
v0.0.3 | Adjust the font size of the state, as percentage of the original size. |
| font_size_header | number | 14 |
v0.3.1 | Adjust the font size of the header, size in pixels. |
| align_header | string | default |
v0.2.0 | Set the alignment of the header, left, right, center or default. |
| align_icon | string | right |
v0.2.0 | Set the alignment of the icon, left, right or state. |
| align_state | string | left |
v0.2.0 | Set the alignment of the current state, left, right or center. |
| lower_bound | number or string | v0.2.3 | Set a fixed lower bound for the graph Y-axis. String value starting with ~ (e.g. ~50) specifies soft bound. |
|
| upper_bound | number or string | v0.2.3 | Set a fixed upper bound for the graph Y-axis. String value starting with ~ (e.g. ~50) specifies soft bound. |
|
| min_bound_range | number | v0.x.x | Applied after everything, makes sure there's a minimum range that the Y-axis will have. Useful for not making small changes look large because of scale. | |
| lower_bound_secondary | number or string | v0.5.0 | Set a fixed lower bound for the graph secondary Y-axis. String value starting with ~ (e.g. ~50) specifies soft bound. |
|
| upper_bound_secondary | number or string | v0.5.0 | Set a fixed upper bound for the graph secondary Y-axis. String value starting with ~ (e.g. ~50) specifies soft bound. |
|
| min_bound_range_secondary | number | v0.x.x | Applied after everything, makes sure there's a minimum range that the secondary Y-axis will have. Useful for not making small changes look large because of scale. | |
| smoothing | boolean | true |
v0.8.0 | Whether to make graph line smooth. |
| state_map | state map object | v0.8.0 | List of entity states to convert (order matters as position becomes a value on the graph). | |
| value_factor | number | 0 | v0.9.4 | Scale value by order of magnitude (e.g. convert Watts to kilo Watts), use negative value to scale down. |
| logarithmic | boolean | false |
v0.10.0 | Use a Logarithmic scale for the graph |
Entities object
Entities may be listed directly (as per sensor.temperature in the example below), or defined using
properties of the Entity object detailed in the following table (as per sensor.pressure in the example below).
| Name | Type | Default | Description |
|---|---|---|---|
| entity (required) | string | Entity id of the sensor. | |
| attribute | string | Retrieves an attribute or sub-attribute (attr1.attr2...) instead of the state | |
| name | string | Set a custom display name, defaults to entity's friendly_name. | |
| color | string | Set a custom color, overrides all other color options including thresholds. | |
| unit | string | Set a custom unit of measurement, overrides unit set in base config ('' value for an empty unit). |
|
| aggregate_func | string | Override for aggregate function used to calculate point on the graph, avg, median, min, max, first, last, sum. |
|
| show_state | boolean | Display the current state. | |
| show_legend_state | boolean | false | Display the current state as part of the legend. |
| show_indicator | boolean | Display a color indicator next to the state, (only when more than two states are visible). | |
| show_graph | boolean | Set to false to completely hide the entity in the graph. | |
| show_line | boolean | Set to false to hide the line. | |
| show_fill | boolean | Set to false to hide the fill. | |
| show_points | boolean | Set to false to hide the points. | |
| show_legend | boolean | Set to false to turn hide from the legend. | |
| state_adaptive_color | boolean | Make the color of the state adapt to the entity color. | |
| y_axis | string | If 'secondary', displays using the secondary y-axis on the right. | |
| fixed_value | boolean | Set to true to graph the entity's current state as a fixed value instead of graphing its state history. | |
| smoothing | boolean | Override for a flag indicating whether to make graph line smooth. |
entities:
  - sensor.temperature
  - entity: sensor.pressure
    name: Pressure
    show_state: true
  - sensor.humidity
Available show options
All properties are optional.
| Name | Default | Options | Description |
|---|---|---|---|
| name | true |
true / false |
Display name. |
| icon | true |
true / false |
Display icon. |
| state | true |
true / false / last |
Display current state. last will show the last graph point's value. |
| graph | line |
line / bar / false |
Display option for the graph. If set to bar a maximum of 96 bars will be displayed. |
| fill | true |
true / false / fade |
Display the line graph fill. |
| points | hover |
true / false / hover |
Display graph data points. |
| legend | true |
true / false |
Display the graph legend (only shown when graph contains multiple entities). |
| average | false |
true / false |
Display average information. |
| extrema | false |
true / false |
Display max/min information. |
| labels | hover |
true / false / hover |
Display Y-axis labels. |
| labels_secondary | hover |
true / false / hover |
Display secondary Y-axis labels. |
| name_adaptive_color | false |
true / false |
Make the name color adapt with the primary entity color. |
| icon_adaptive_color | false |
true / false |
Make the icon color adapt with the primary entity color. |
| loading_indicator | true |
true / false |
Show loading indicator while attempting to retrieve a history. |
Line color object
See dynamic line color for example usage.
| Name | Type | Default | Description |
|---|---|---|---|
| value (required except in interpolation (see below)) | number | The threshold for the color stop. | |
| color (required) | string | Color in 6 digit hex format (e.g. #008080). |
Line color interpolation of stop values
As long as the first and last threshold stops have value properties, intermediate stops can exclude value; they will be interpolated linearly. For example, given stops like:
color_thresholds:
  - value: 0
    color: "#ff0000"
  - color: "#ffff00"
  - color: "#00ff00"
  - value: 4
    color: "#0000ff"
The values will be interpolated as:
color_thresholds:
  - value: 0
    color: "#ff0000"
  - value: 1.333333
    color: "#ffff00"
  - value: 2.666667
    color: "#00ff00"
  - value: 4
    color: "#0000ff"
The example above will result in the following colors of the graph: if value is
* between 0 (including this value) and 1.33333, the color is #ff0000,
* between 1.33333 (including this value) and 2.666667, the color is #ffff00,
* between 2.666667 (including this value) and 4, the color is #00ff00,
* equal to or more than 4, the color is #0000ff.
As a shorthand, you can just use a color string for the stops that you want interpolated:
  - value: 0
    color: "#ff0000"
  - "#ffff00"
  - "#00ff00"
  - value: 4
    color: "#0000ff"
Action object options
| Name | Type | Default | Options | Description |
|---|---|---|---|---|
| action | string | more-info |
more-info / navigate / call-service / url / none |
Action to perform. |
| entity | string | Any entity id | Override default entity of more-info, when action is defined as more-info. |
|
| service | string | Any service | Service to call (e.g. media_player.toggle) when action is defined as call-service. |
|
| service_data | object | Any service data | Service data to include with the service call (e.g. entity_id: media_player.office). |
|
| navigation_path | string | Any path | Path to navigate to (e.g. /lovelace/0/) when action is defined as navigate. |
|
| url | string | Any URL | URL to open when action is defined as url. |
State map object
| Name | Type | Default | Description |
|---|---|---|---|
| value ***( |
Core symbols most depended-on inside this repo
maxShape
Languages
Modules by API surface
Dependencies from manifests, versioned
For agents
$ claude mcp add mini-graph-card \
  -- python -m otcore.mcp_server <graph>