github.com/jwilber/roughViz @main sqlite
README
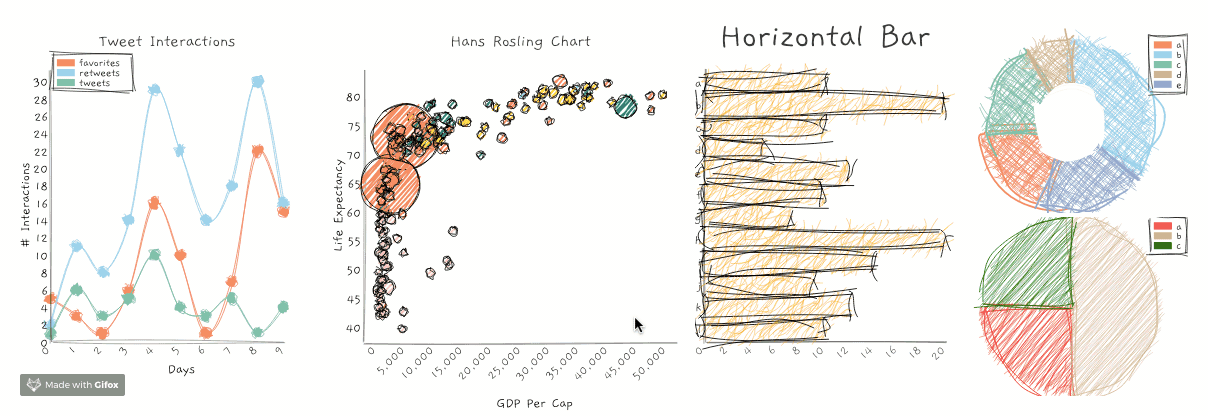
roughViz.js is a reusable JavaScript library for creating sketchy/hand-drawn styled charts in the browser, based on D3v5, roughjs, and handy.
Why?
Use these charts where the communication goal is to show intent or generality, and not absolute precision. Or just because they're fun and look weird.
Chart Types
| Chart Type | API |
|---|---|
| Bar | roughViz.Bar |
| Horizontal Bar | roughViz.BarH |
| Donut | roughViz.Donut |
| Line | roughViz.Line |
| Pie | roughViz.Pie |
| Scatter | roughViz.Scatter |
| Stacked Bar | roughViz.StackedBar |
Visit this link for interactive examples of each chart.
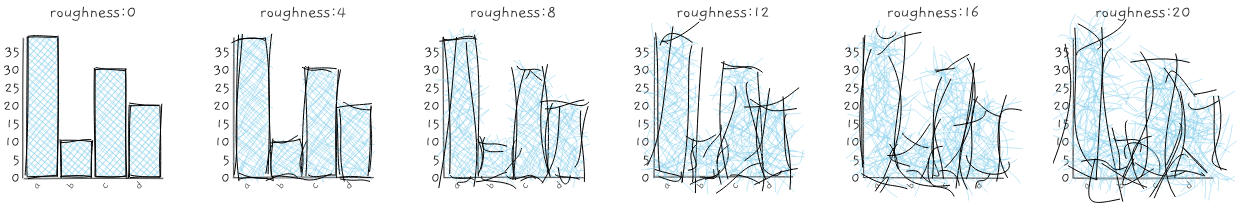
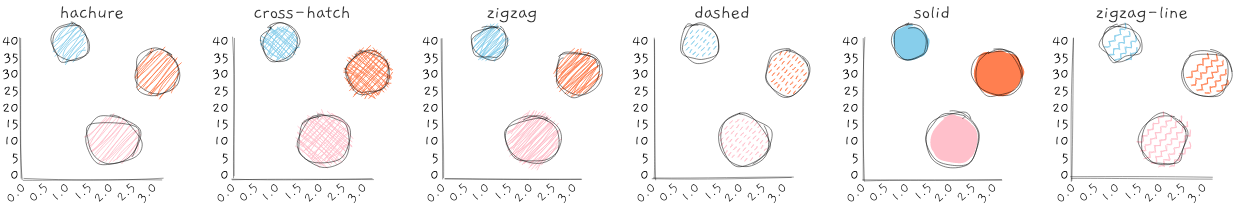
Features
Apply the features of roughjs to each chart:
roughness:
fillStyle
fillWeight
As well as additional chart-specific options (see API below)
Installation
Via CDN (expose the roughViz global in html):
<script src="https://unpkg.com/rough-viz@2.0.5"></script>
Via npm:
npm install rough-viz
Want to use with React? There's a wrapper!:
npm install react-roughviz
Want to use with Vue? There's a wrapper!:
npm install vue-roughviz
Want to use it with Python? Go crazy:
pip install py-roughviz
How to use
If you're using ESM, make sure to import the library:
import roughViz from "rough-viz";
Create some container elements, one for each chart:
In the javascript, just create charts, referencing the desired container:
// create Bar chart from csv file, using default options
 new roughViz.Bar({
    element: '#viz0', // container selection
    data: 'https://raw.githubusercontent.com/jwilber/random_data/master/flavors.csv',
    labels: 'flavor',
    values: 'price'
});

// create Donut chart using defined data & customize plot options
new roughViz.Donut(
  {
    element: '#viz1',
    data: {
      labels: ['North', 'South', 'East', 'West'],
      values: [10, 5, 8, 3]
    },
    title: "Regions",
    width: window.innerWidth / 4,
    roughness: 8,
    colors: ['red', 'orange', 'blue', 'skyblue'],
    stroke: 'black',
    strokeWidth: 3,
    fillStyle: 'cross-hatch',
    fillWeight: 3.5,
  }
);
API
roughViz.Bar
Required
- element [string]: Id or class of container element.
- data: Data with which to construct chart.
Can be either an object or string.
-
If object: must contain
labelsandvalueskeys:js new roughViz.Bar({ element: '.viz', data: {labels: ['a', 'b'], values: [10, 20]} }) -
If string: must be a path/url to a
csvortsv, and you must also specify thelabelsandvaluesas separate attributes that represent columns in said file:js new roughViz.Bar({ element: '#viz0', data: 'stringToDataUrl.csv', labels: 'nameOfLabelsColumn', values: 'nameOfValuesColumn', })
Optional
- axisFontSize [string]: Font-size for axes' labels. Default: '1rem'.
- axisRoughness [number]: Roughness for x & y axes. Default: 0.5.
- axisStrokeWidth [number]: Stroke-width for x & y axes. Default: 0.5.
- bowing [number]: Chart bowing. Default: 0.
- color [string]: Color for each bar. Default: 'skyblue'.
- fillStyle [string]: Bar fill-style. Should be one of fillStyles shown above.
- fillWeight [number]: Weight of inner paths' color. Default: 0.5.
- font: Font-family to use. You can use 0 or gaegu to use Gaegu, or 1 or indie flower to use Indie Flower. Or feed it something else. Default: Gaegu.
- highlight [string]: Color for each bar on hover. Default: 'coral'.
- innerStrokeWidth [number]: Stroke-width for paths inside bars. Default: 1.
- interactive [boolean]: Whether or not chart is interactive. Default: true.
- labelFontSize [string]: Font-size for axes' labels. Default: '1rem'.
- margin [object]: Margin object. Default: {top: 50, right: 20, bottom: 70, left: 100}
- padding [number]: Padding between bars. Default: 0.1.
- roughness [number]: Roughness level of chart. Default: 1.
- simplification [number]: Chart simplification. Default 0.2.
- stroke [string]: Color of bars' stroke. Default: black.
- strokeWidth [number]: Size of bars' stroke. Default: 1.
- title [string]: Chart title. Optional.
- titleFontSize [string]: Font-size for chart title. Default: '1rem'.
- tooltipFontSize [string]: Font-size for tooltip. Default: '0.95rem'.
- xLabel [string]: Label for x-axis.
- yLabel [string]: Label for y-axis.
roughViz.BarH
Required
- element [string]: Id or class of container element.
- data: Data with which to construct chart.
Can be either an object or string.
-
If object: must contain
labelsandvalueskeys:js new roughViz.BarH({ element: '.viz', data: {labels: ['a', 'b'], values: [10, 20]} }) -
If string: must be a path/url to a
csvortsv, and you must also specify thelabelsandvaluesas separate attributes that represent columns in said file:js new roughViz.BarH({ element: '#viz0', data: 'stringToDataUrl.csv', labels: 'nameOfLabelsColumn', values: 'nameOfValuesColumn', })
Optional
- axisFontSize [string]: Font-size for axes' labels. Default: '1rem'.
- axisRoughness [number]: Roughness for x & y axes. Default: 0.5.
- axisStrokeWidth [number]: Stroke-width for x & y axes. Default: 0.5.
- bowing [number]: Chart bowing. Default: 0.
- color [string]: Color for each bar. Default: 'skyblue'.
- fillStyle [string]: Bar fill-style. Should be one of fillStyles shown above.
- fillWeight [number]: Weight of inner paths' color. Default: 0.5.
- font: Font-family to use. You can use 0 or gaegu to use Gaegu, or 1 or indie flower to use Indie Flower. Or feed it something else. Default: Gaegu.
- highlight [string]: Color for each bar on hover. Default: 'coral'.
- innerStrokeWidth [number]: Stroke-width for paths inside bars. Default: 1.
- interactive [boolean]: Whether or not chart is interactive. Default: true.
- labelFontSize [string]: Font-size for axes' labels. Default: '1rem'.
- margin [object]: Margin object. Default: {top: 50, right: 20, bottom: 70, left: 100}
- padding [number]: Padding between bars. Default: 0.1.
- roughness [number]: Roughness level of chart. Default: 1.
- simplification [number]: Chart simplification. Default 0.2.
- stroke [string]: Color of bars' stroke. Default: black.
- strokeWidth [number]: Size of bars' stroke. Default: 1.
- title [string]: Chart title. Optional.
- titleFontSize [string]: Font-size for chart title. Default: '1rem'.
- tooltipFontSize [string]: Font-size for tooltip. Default: '0.95rem'.
- xLabel [string]: Label for x-axis.
- yLabel [string]: Label for y-axis.
roughViz.Donut
Required
- element [string]: Id or class of container element.
- data: Data with which to construct chart.
Can be either an object or string.
-
If object: must contain
labelsandvalueskeys:js new roughViz.Donut({ element: '.viz', data: {labels: ['a', 'b'], values: [10, 20]} }) -
If string: must be a path/url to a
csv,json, ortsv, and you must also specify thelabelsandvaluesas separate attributes that represent columns in said file:js new roughViz.Donut({ element: '#viz0', data: 'stringToDataUrl.csv', labels: 'nameOfLabelsColumn', values: 'nameOfValuesColumn', })
Optional
- bowing [number]: Chart bowing. Default: 0.
- colors [array]: Array of colors for each arc. Default: ['coral', 'skyblue', '#66c2a5', 'tan', '#8da0cb', '#e78ac3', '#a6d854', '#ffd92f', 'tan', 'orange'].
- fillStyle [string]: Bar fill-style. Should be one of fillStyles shown above.
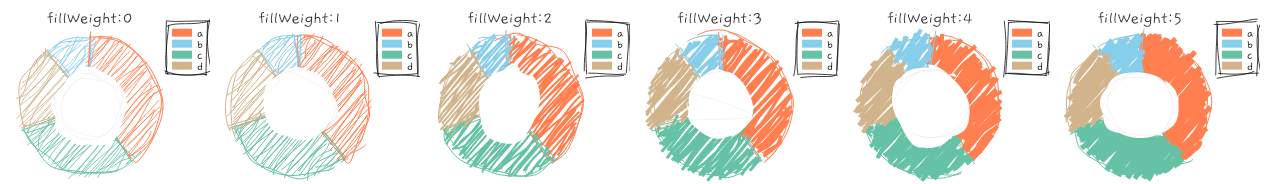
- fillWeight [number]: Weight of inner paths' color. Default: 0.85.
- font: Font-family to use. You can use 0 or gaegu to use Gaegu, or 1 or indie flower to use Indie Flower. Or feed it something else. Default: Gaegu.
- highlight [string]: Color for each arc on hover. Default: 'coral'.
- innerStrokeWidth [number]: Stroke-width for paths inside arcs. Default: 0.75.
- interactive [boolean]: Whether or not chart is interactive. Default: true.
- legend [boolean]: Whether or not to add legend. Default: 'true'.
- legendPosition [string]: Position of legend. Should be either 'left' or 'right'. Default: 'right'.
- margin [object]: Margin object. Default: {top: 50, right: 20, bottom: 70, left: 100}
- padding [number]: Padding between bars. Default: 0.1.
- roughness [number]: Roughness level of chart. Default: 1.
- simplification [number]: Chart simplification. Default 0.2.
- strokeWidth [number]: Size of bars' stroke. Default: 1.
- title [string]: Chart title. Optional.
- titleFontSize [string]: Font-size for chart title. Default: '1rem'.
- tooltipFontSize [string]: Font-size for tooltip. Default: '0.95rem'.
roughViz.Line
Required
- element [string]: Id or class of container element.
- data: Must be a path/url to a csv or tsv, and you must also specify the each y as separate attributes that represent columns in said file. Each attribute prefaced with y (except yLabel) will receive its own line:
js
   new roughViz.Line({
     element: '#viz0',
     data: 'https://raw.githubusercontent.com/jwilber/random_data/master/profits.csv',
     y1: 'revenue',
     y2: 'cost',
     y3: 'profit'
   })
Optional
- axisFontSize [string]: Font-size for axes' labels. Default: '1rem'.
- axisRoughness [number]: Roughness for x & y axes. Default: 0.5.
- axisStrokeWidth [number]: Stroke-width for x & y axes. Default: 0.5.
- bowing [number]: Chart bowing. Default: 0.
- circle [boolean]: Whether or not to add circles to chart. Default: true.
- circleRadius [number]: Radius of circles. Default: 10.
- circleRoughness [number]: Roughness of circles. Default: 2.
- colors [array or string]: Array of colors for each arc. Default: ['coral', 'skyblue', '#66c2a5', 'tan', '#8da0cb', '#e78ac3', '#a6d854', '#ffd92f', 'tan', 'orange']. If string (e.g. 'blue'), all circles will take that color.
- fillStyle [string]: Bar fill-style. Should be one of fillStyles shown above.
- fillWeight [number]: Weight of inner paths' color. Default: 0.5.
- font: Font-family to use. You can use 0 or gaegu to use Gaegu, or 1 or indie flower to use Indie Flower. Or feed it something else. Default: Gaegu.
- interactive [boolean]: Whether or not chart is interactive. Default: true.
- labelFontSize [string]: Font-size for axes' labels. Default: '1rem'.
- legend [boolean]: Whether or not to add legend. Default: true.
- legendPosition [string]: Position of legend. Should be either 'left' or 'right'. Default: 'right'.
- margin [object]: Margin object. Default: {top: 50, right: 20, bottom: 70, left: 100}
- roughness [number]: Roughness level of chart. Default: 1.
- simplification [number]: Chart simplification. Default 0.2.
- stroke [string]: Color of lines' stroke. Default: this.colors.
- strokeWidth [number]: Size of lines' stroke. Default: 1.
- title [string]: Chart title. Optional.
- titleFontSize [string]: Font-size for chart title. Default: '0.95rem'.
- tooltipFontSize [string]: Font-size for tooltip. Default: '0.95rem'.
- xLabel [string]: Label for x-axis.
- yLabel [string]: Label for y-axis.
roughViz.Pie
Required
- element [string]: Id or class of container element.
- data: Data with which to construct chart.
Can be either an object or string.
-
If object: must contain
labelsandvalueskeys:js new roughViz.Pie({ element: '.viz', data: {labels: ['a', 'b'], values: [10, 20]} }) -
If string: must be a path/url to a
csv,json, ortsv, and you must also specify thelabelsandvaluesas separate attributes that represent columns in said file:js new roughViz.Pie({ element: '#viz0', data: 'stringToDataUrl.csv', labels: 'nameOfLabelsColumn', values: 'nameOfValuesColumn', })
Optional
- bowing [number]: Chart bowing. Default: 0.
- colors [array]: Array of colors for each arc. Default: ['coral', 'skyblue', '#66c2a5', 'tan', '#8da0cb', '#e78ac3', '#a6d854', '#ffd92f', 'tan', 'orange'].
- fillStyle [string]: Bar fill-style. Should be one of fillStyles shown a
Core symbols most depended-on inside this repo
resolveFontShape
Languages
Modules by API surface
Dependencies from manifests, versioned
For agents
$ claude mcp add roughViz \
  -- python -m otcore.mcp_server <graph>