github.com/go-echarts/go-echarts @v2.7.2 sqlite
README
<img src="https://user-images.githubusercontent.com/19553554/52535979-c0d0e680-2d8f-11e9-85c8-2e9f659e7c6f.png" width=300 height=300 />
go-echarts
<em>🎨 The adorable charts library for Golang.</em>


<a href="https://github.com/go-echarts/go-echarts/actions/workflows/ci.yml" style="text-decoration: none;">
    <img src="https://github.com/go-echarts/go-echarts/actions/workflows/ci.yml/badge.svg" alt="Build Status">
</a>
<a href="https://goreportcard.com/report/github.com/go-echarts/go-echarts" style="text-decoration: none;">
    <img src="https://goreportcard.com/badge/github.com/go-echarts/go-echarts" alt="Go Report Card">
</a>
<a href="https://github.com/go-echarts/go-echarts/pulls" style="text-decoration: none;">
    <img src="https://img.shields.io/badge/contributions-welcome-brightgreen.svg?style=flat" alt="Contributions welcome">
</a>
<a href="https://opensource.org/licenses/MIT" style="text-decoration: none;">
    <img src="https://img.shields.io/badge/License-MIT-brightgreen.svg" alt="MIT License">
</a>
<a href="https://pkg.go.dev/github.com/go-echarts/go-echarts/v2" style="text-decoration: none;">
    <img src="https://godoc.org/github.com/go-echarts/go-echarts?status.svg" alt="GoDoc">
</a>
<a href="https://echarts.apache.org/" style="text-decoration: none;">
    <img src="https://img.shields.io/badge/echarts-_v5.4.3-orange" alt="echartsVersion">
</a>
<a href="https://go-echarts.github.io/go-echarts" style="text-decoration: none;">
    <img src="https://img.shields.io/badge/docs-_handbook-blue" alt="handbook">
</a>
If a language can be used to build web scrapers, it definitely needs to provide a graceful data visualization library. --- by dongdong.
In the Golang ecosystem, there are not many choices for data visualization libraries.
The development of go-echarts aims to
provide a simple yet powerful data visualization library for Golang.
Apache ECharts is an awesome charting and visualization library,
it supports adorable chart types and various interactive features.
and there have many program languages interactive with Echarts, such as pyecharts,
which go-echarts learns and has evolved a lot from, and the echarts4j either.
🔰 Installation
Classic way to get go-echarts
# this may be not a good choice to use v2 go-echarts without gomod(GO111MODULE=off), the
# next generation version management system
# Technically, you could use go-echarts in the way below, if you have a better workaround, please let us know....

$ go get -u github.com/go-echarts/go-echarts/...
$ cd $go-echarts-project
$ mkdir v2 && mv charts components datasets opts render templates types v2
Use gomod style
$ go get -u github.com/go-echarts/go-echarts/v2/...
OR
# go.mod

require github.com/go-echarts/go-echarts/v2
⏳ Version
The go-echarts project is being developed under v2 version and the active codebase is on the master branch.
v1 and v2 are incompatible which means that you cannot upgrade go-echarts from v1 to v2 smoothly. But I think it is worth trying that new version.
Especially, when there contains mino changes (usually in enhancement), we will release the rc version before a
standard release.
So, if you upgrade your projects cross the rc versions, maybe need little adjust, and I believe it is worthy to do.
✨ Features
- Clean and comprehensive API.
- Visualize your data in 25+ different ways.
- Highly configurable chart options.
- Detailed documentation and a rich collection of examples.
- Visualize your geographical data with 400+ maps.
📝 Usage
It's easy to get started with go-echarts with the handbook, go-echarts/examples and GoDocs.
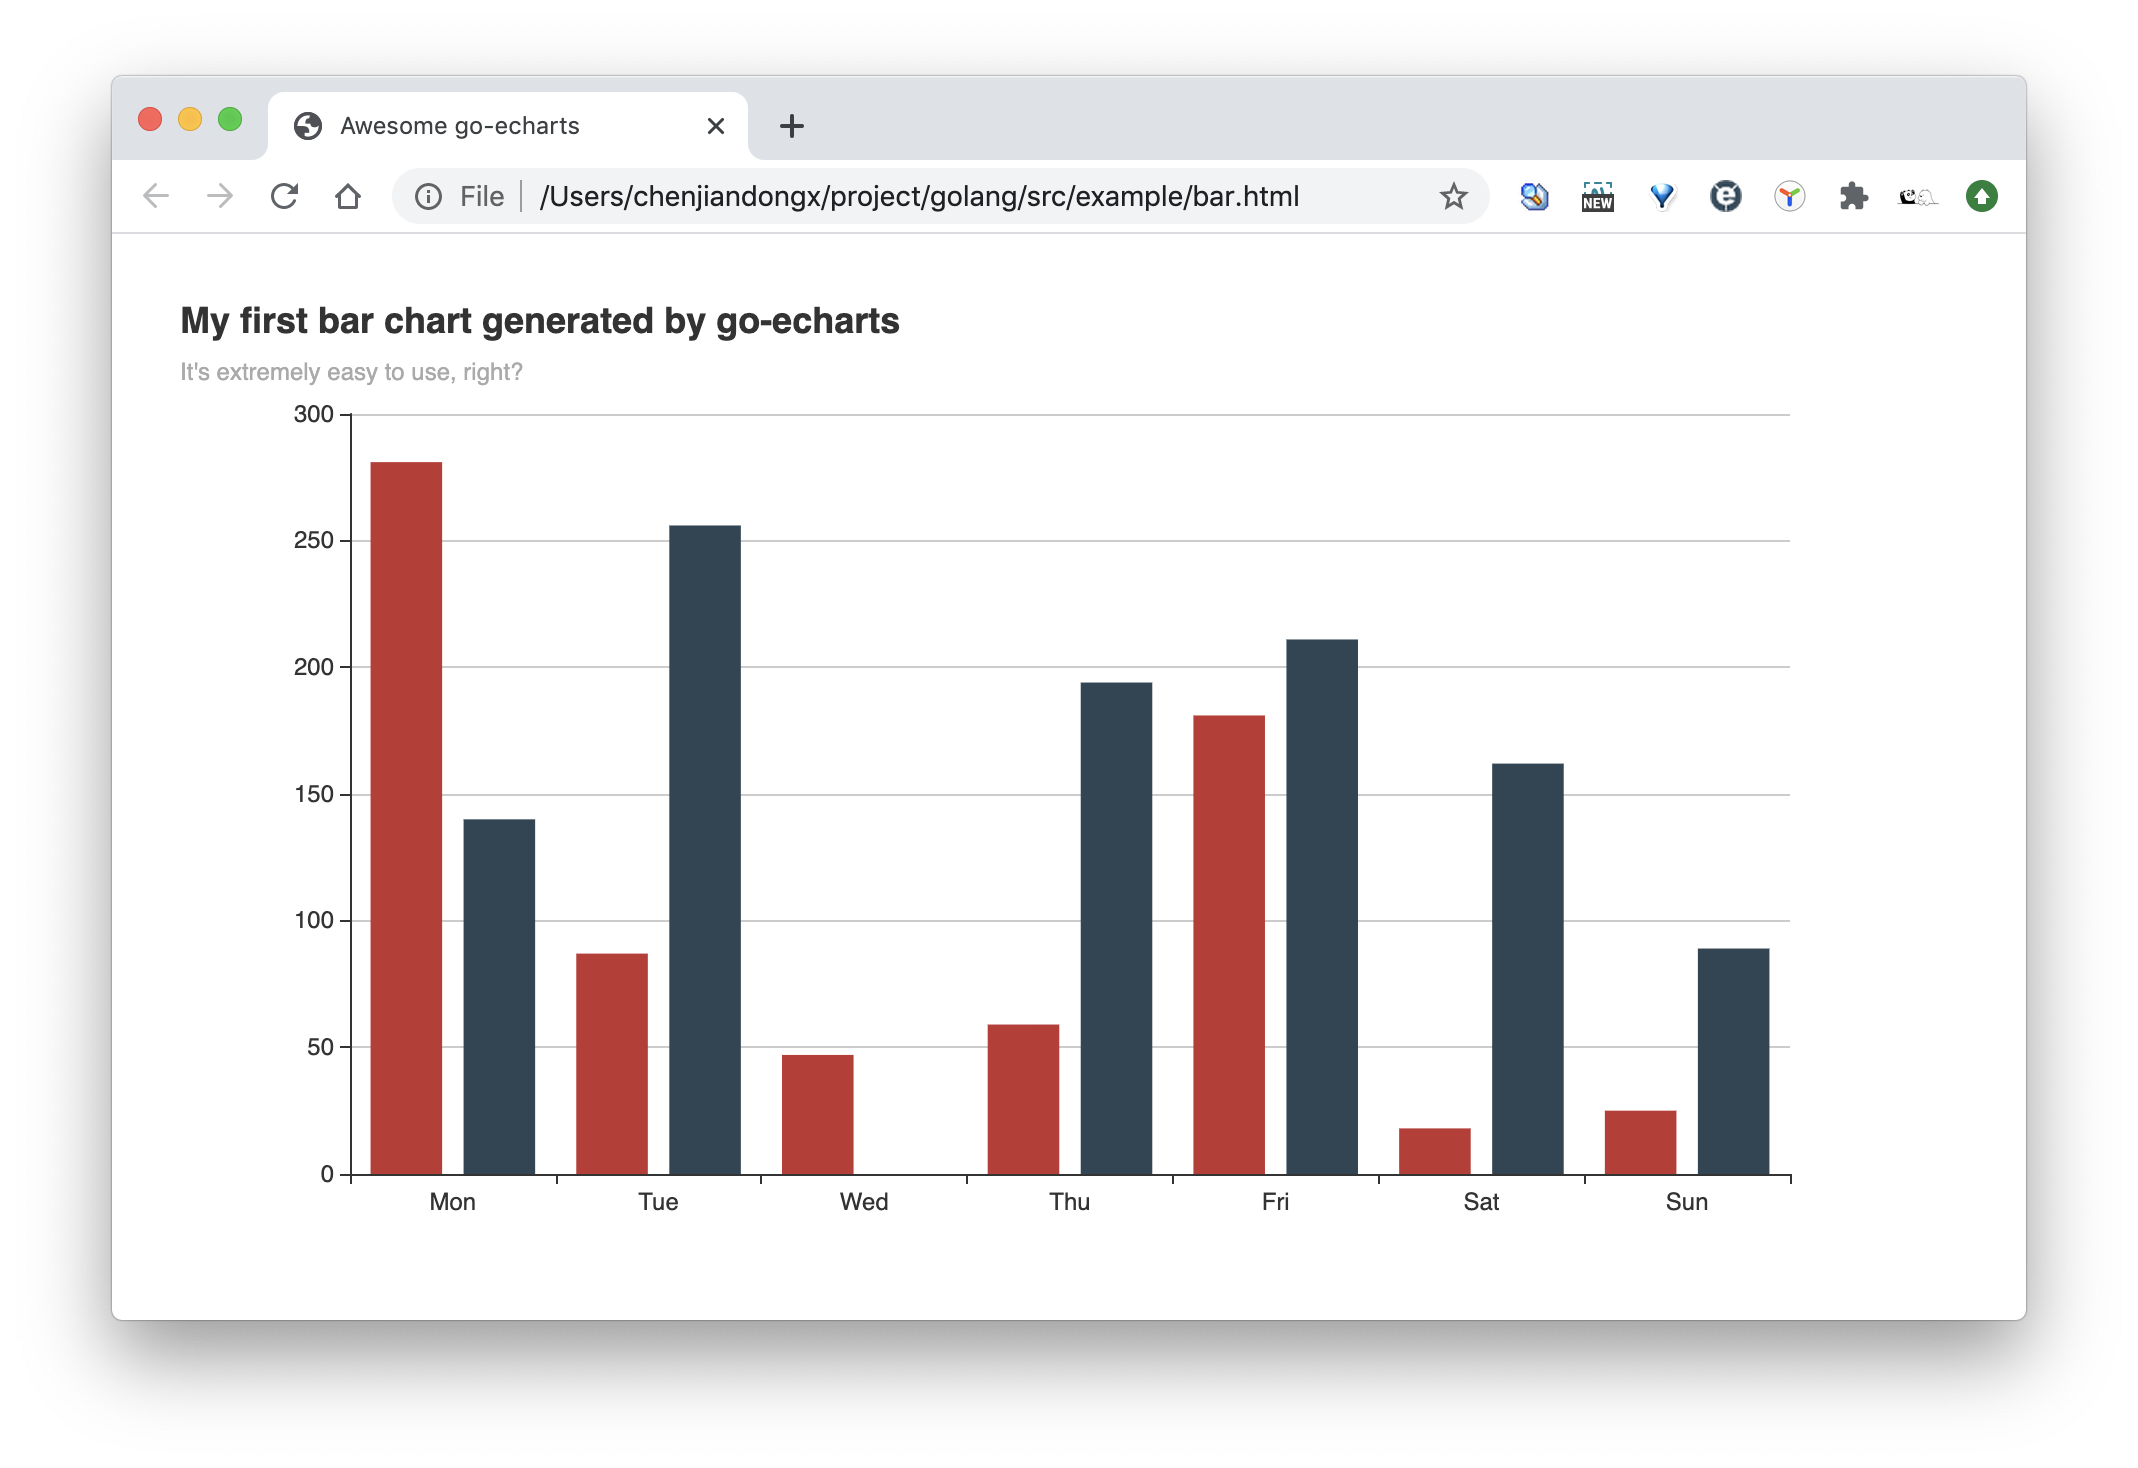
In this example, we create a simple bar chart with only a few lines of code.
package main

import (
    "math/rand"
    "os"

    "github.com/go-echarts/go-echarts/v2/charts"
    "github.com/go-echarts/go-echarts/v2/opts"
)

// generate random data for bar chart
func generateBarItems() []opts.BarData {
    items := make([]opts.BarData, 0)
    for i := 0; i < 7; i++ {
        items = append(items, opts.BarData{Value: rand.Intn(300)})
    }
    return items
}

func main() {
    // create a new bar instance
    bar := charts.NewBar()
    // set some global options like Title/Legend/ToolTip or anything else
    bar.SetGlobalOptions(charts.WithTitleOpts(opts.Title{
        Title:    "My first bar chart generated by go-echarts",
        Subtitle: "It's extremely easy to use, right?",
    }))

    // Put data into instance
    bar.SetXAxis([]string{"Mon", "Tue", "Wed", "Thu", "Fri", "Sat", "Sun"}).
        AddSeries("Category A", generateBarItems()).
        AddSeries("Category B", generateBarItems())
    // Where the magic happens
    f, _ := os.Create("bar.html")
    bar.Render(f)
}
And the generated bar.html is rendered as below. Isn't that cool!
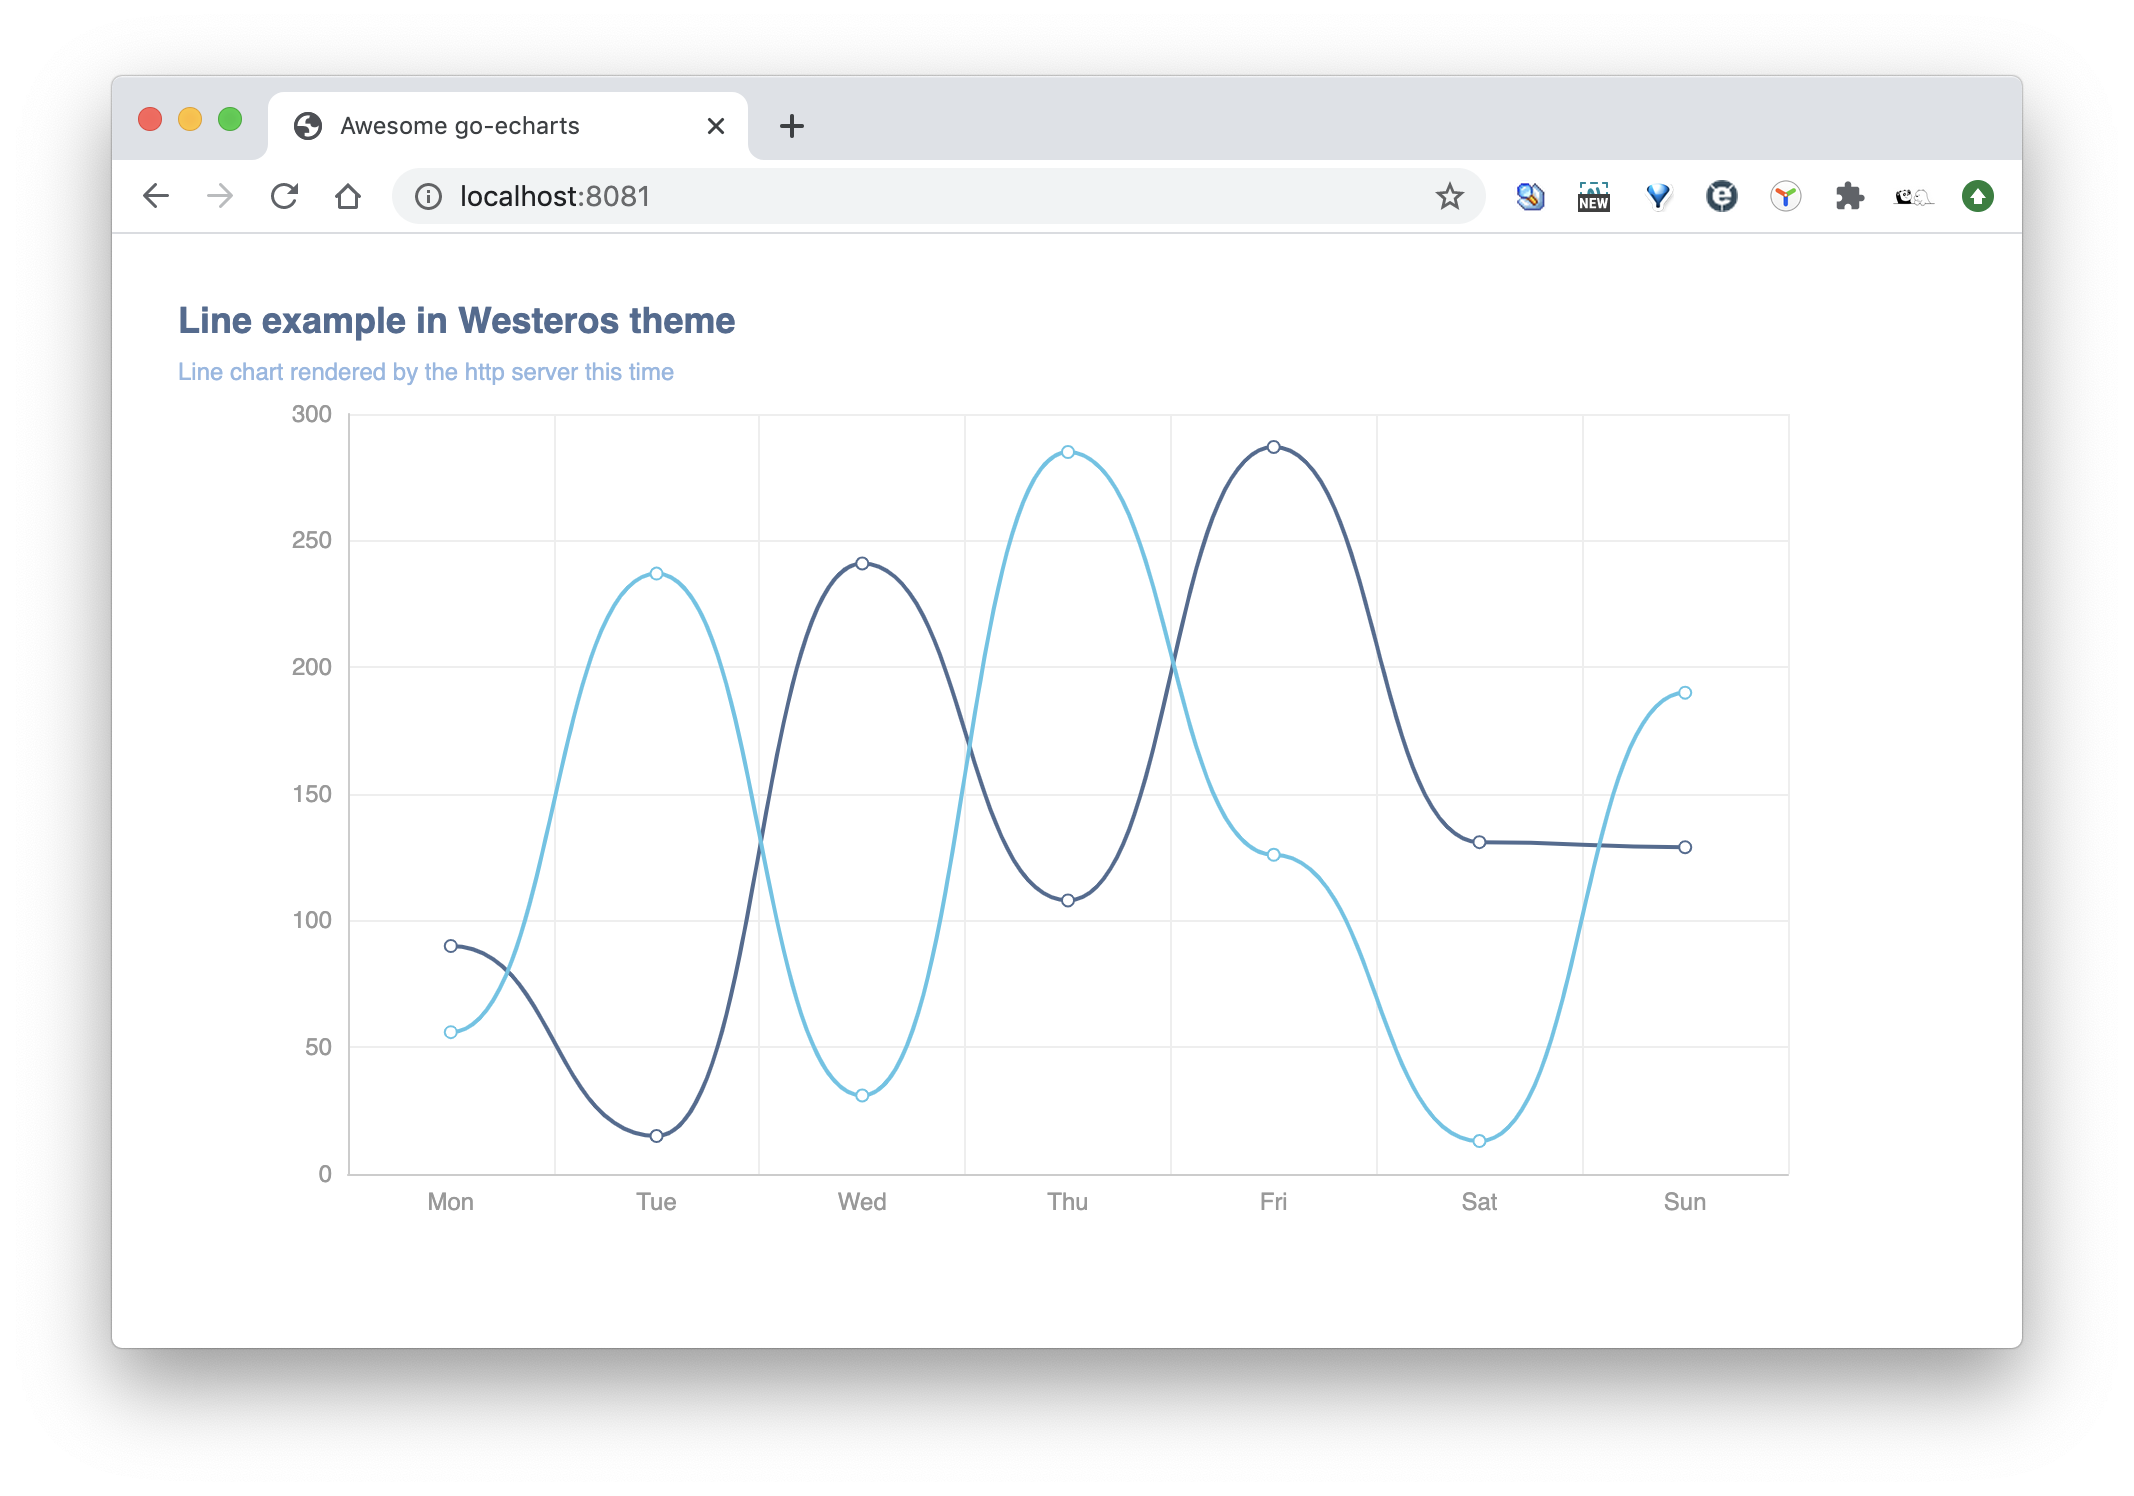
Of course we can also start a listening web server with net/http.
package main

import (
    "math/rand"
    "net/http"

    "github.com/go-echarts/go-echarts/v2/charts"
    "github.com/go-echarts/go-echarts/v2/opts"
    "github.com/go-echarts/go-echarts/v2/types"
)

// generate random data for line chart
func generateLineItems() []opts.LineData {
    items := make([]opts.LineData, 0)
    for i := 0; i < 7; i++ {
        items = append(items, opts.LineData{Value: rand.Intn(300)})
    }
    return items
}

func httpserver(w http.ResponseWriter, _ *http.Request) {
    // create a new line instance
    line := charts.NewLine()
    // set some global options like Title/Legend/ToolTip or anything else
    line.SetGlobalOptions(
        charts.WithInitializationOpts(opts.Initialization{Theme: types.ThemeWesteros}),
        charts.WithTitleOpts(opts.Title{
            Title:    "Line example in Westeros theme",
            Subtitle: "Line chart rendered by the http server this time",
        }))

    // Put data into instance
    line.SetXAxis([]string{"Mon", "Tue", "Wed", "Thu", "Fri", "Sat", "Sun"}).
        AddSeries("Category A", generateLineItems()).
        AddSeries("Category B", generateLineItems()).
        SetSeriesOptions(charts.WithLineChartOpts(opts.LineChart{Smooth: opts.Bool(true)}))
    line.Render(w)
}

func main() {
    http.HandleFunc("/", httpserver)
    http.ListenAndServe(":8081", nil)
}
🔖 Gallery
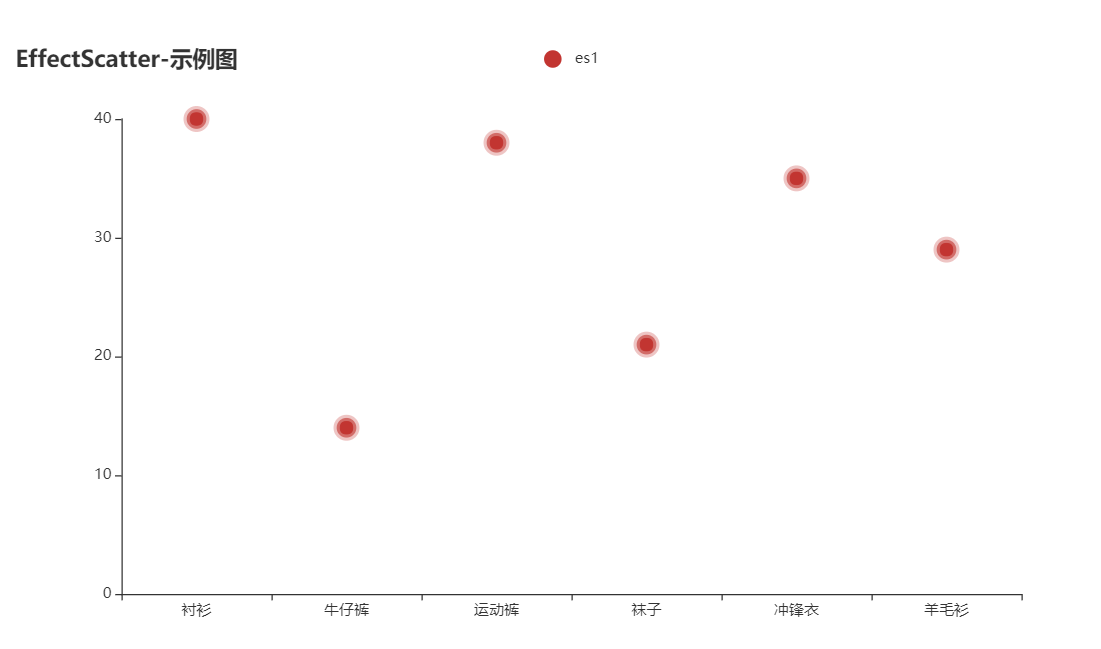
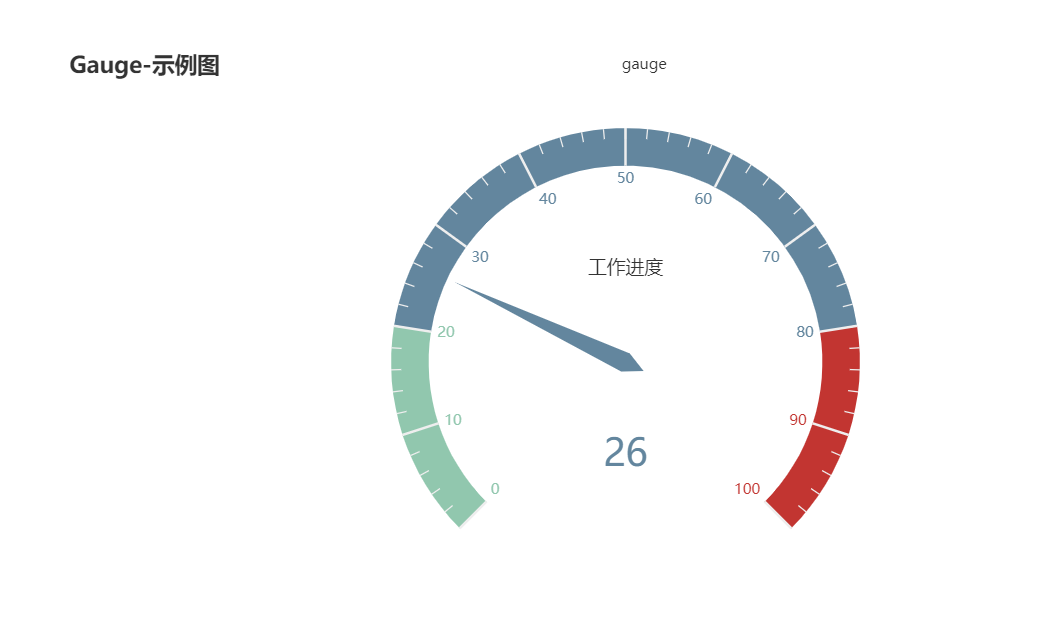
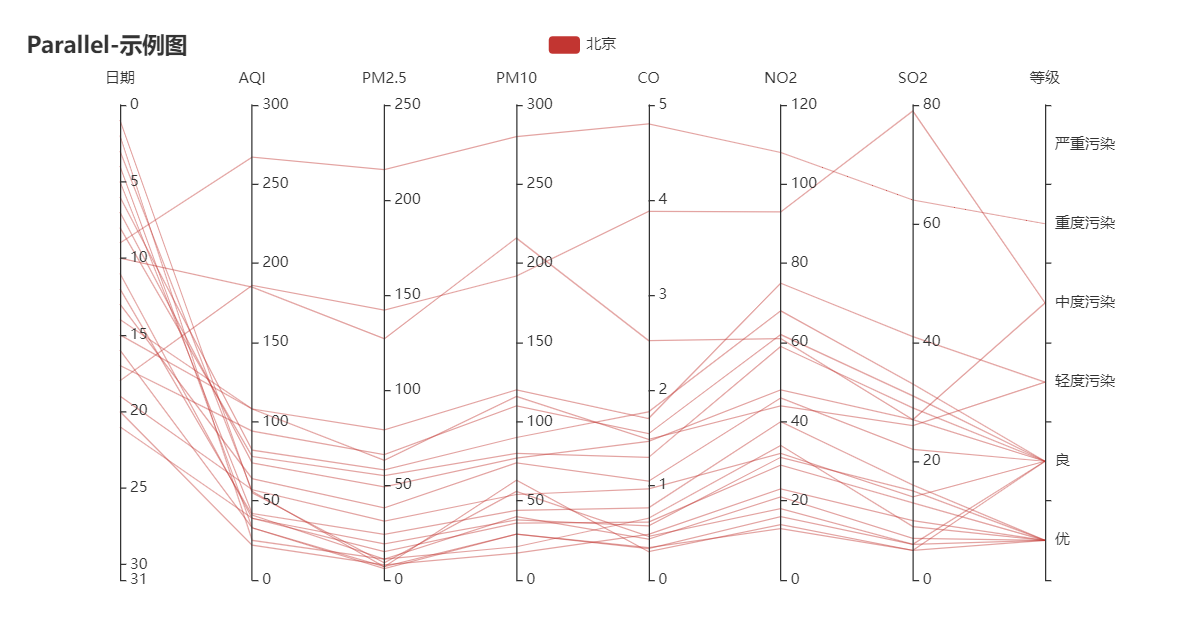
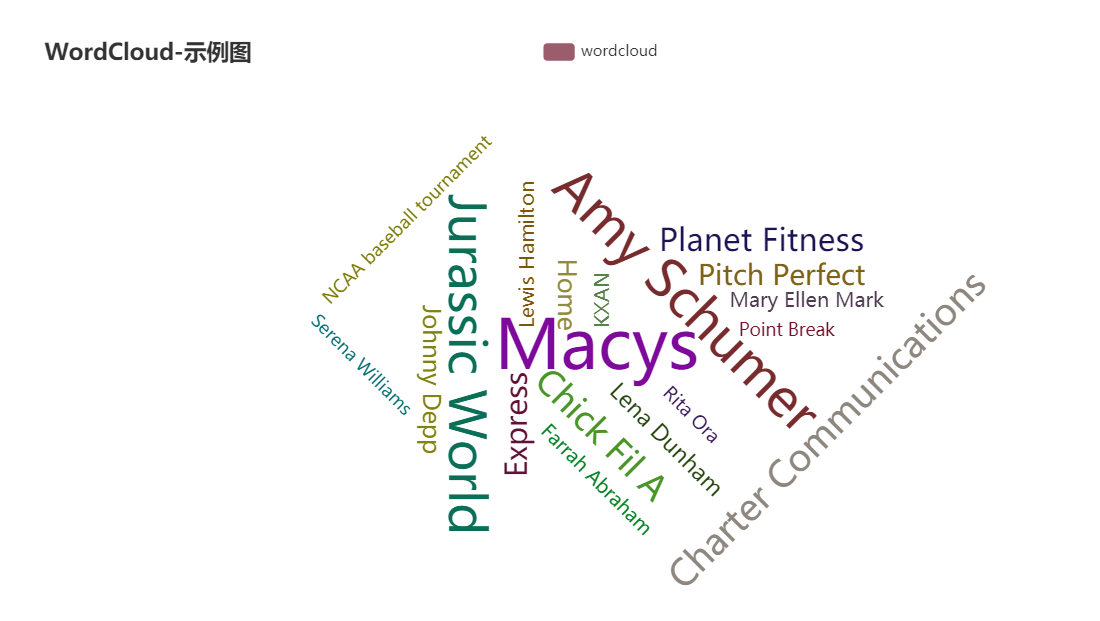
For more information, please refer to handbook, go-echarts/examples and the GoDoc.
💡 Contribution
go-echarts is an open source project and built on the top of other open-source projects. Welcome all the kinds of contributions. No matter it is for typo fix, bug fix or big new features. Please do not hesitate to ask a question or send a pull request.
We strongly value documentation and integration with other projects, so we are very glad to accept improvements for these aspects.
❤️ Contributors
📃 License
MIT ©go-echarts
Extension points exported contracts — how you extend this code
Renderer (Interface)Core symbols most depended-on inside this repo
ValidateShape
Languages
Modules by API surface
Used by 1 indexed graphs manifest dependencies, hub-wide
Dependencies from manifests, versioned
For agents
$ claude mcp add go-echarts \
  -- python -m otcore.mcp_server <graph>