github.com/fossasia/visdom @v0.2.4 sqlite
README
 Creating, organizing & sharing visualizations of live, rich data. Supports Python.
Jump To: Setup, Usage, API, Customizing, Contributing, License
<a href="https://github.com/fossasia/visdom/releases"><img src="https://img.shields.io/github/v/release/fossasia/visdom?colorA=363a4f&colorB=a6da95&style=for-the-badge"/></a>
<a href="https://pypi.org/project/visdom"><img src="https://img.shields.io/pypi/dd/visdom?colorA=363a4f&colorB=156df1&style=for-the-badge"></a>
<a href="https://github.com/fossasia/visdom/commits"><img src="https://img.shields.io/github/commit-activity/m/fossasia/visdom?colorA=363a4f&colorB=0099ff&style=for-the-badge"/></a>
<a href="https://github.com/fossasia/visdom/contributors"><img src="https://img.shields.io/github/contributors/fossasia/visdom?colorA=363a4f&colorB=60b9f4&style=for-the-badge"/></a>
Visdom aims to facilitate visualization of (remote) data with an emphasis on supporting scientific experimentation.
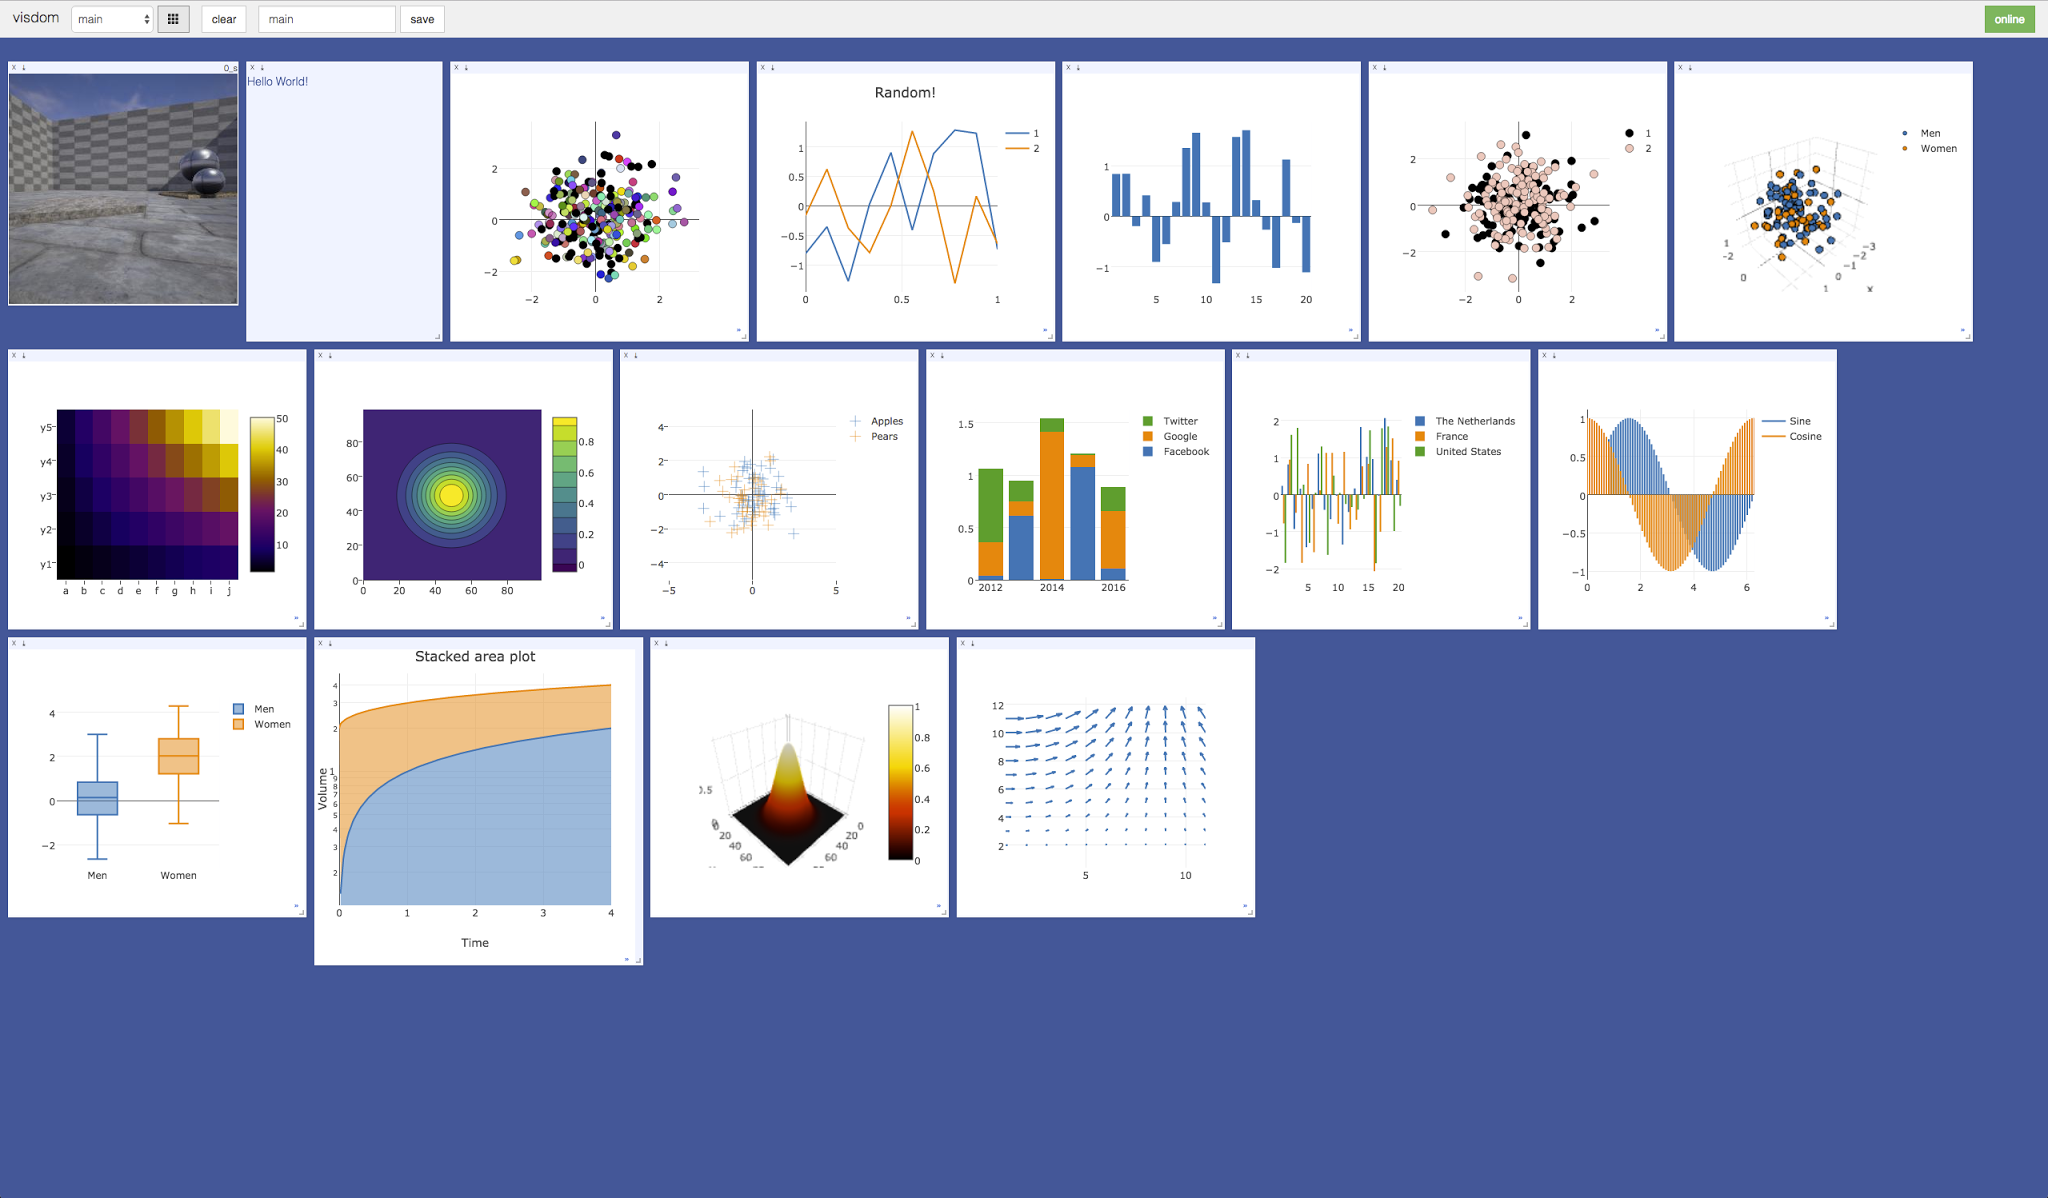
Broadcast visualizations of plots, images, and text for yourself and your collaborators. Organize your visualization space programmatically or through the UI to create dashboards for live data, inspect results of experiments, or debug experimental code.


Concepts
Visdom has a simple set of features that can be composed for various use-cases.
Windows

The UI begins as a blank slate – you can populate it with plots, images, and text. These appear in windows that you can drag, drop, resize, and destroy. The windows live in envs and the state of envs is stored across sessions. You can download the content of windows – including your plots in svg.
Tip: You can use the zoom of your browser to adjust the scale of the UI.
Callbacks
The python Visdom implementation supports callbacks on a window. The demo shows an example of this in the form of an editable text pad. The functionality of these callbacks allows the Visdom object to receive and react to events that happen in the frontend.
You can subscribe a window to events by adding a function to the event handlers dict for the window id you want to subscribe by calling viz.register_event_handler(handler, win_id) with your handler and the window id. Multiple handlers can be registered to the same window. You can remove all event handlers from a window using viz.clear_event_handlers(win_id). When an event occurs to that window, your callbacks will be called on a dict containing:
event_type: one of the below event typespane_data: all of the stored contents for that window including layout and content.eid: the current environment idtarget: the window id the event is called on
Additional parameters are defined below.
Right now the following callback events are supported:
Close- Triggers when a window is closed. Returns a dict with only the aforementioned fields.KeyPress- Triggers when a key is pressed. Contains additional parameters:key- A string representation of the key pressed (applying state modifiers such as SHIFT)key_code- The javascript event keycode for the pressed key (no modifiers)
PropertyUpdate- Triggers when a property is updated in Property panepropertyId- Position in properties listvalue- New property value
Click- Triggers when Image pane is clicked on, has a parameter:image_coord- dictionary with the fieldsxandyfor the click coordinates in the coordinate frame of the possibly zoomed/panned image (not the enclosing pane).
Editable Plot Parameters
Use the top-right edit-Button to inspect all parameters used for plot in the respective window.
The visdom client supports dynamic change of plot parameters as well. Just change one of the listed parameters, the plot will be altered on-the-fly.
Click the button again to close the property list.
Environments

You can partition your visualization space with envs. By default, every user will have an env called main. New envs can be created in the UI or programmatically. The state of envs is chronically saved. Environments are able to keep entirely different pools of plots.
You can access a specific env via url: http://localhost.com:8097/env/main. If your server is hosted, you can share this url so others can see your visualizations too.
Environments are automatically hierarchically organized by the first _.
Selecting Environments
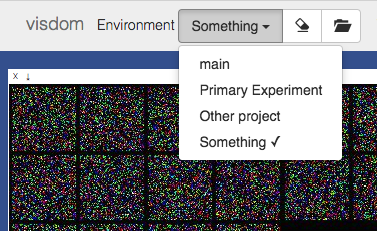
From the main page it is possible to toggle between different environments using the environment selector. Selecting a new environment will query the server for the plots that exist in that environment. The environment selector allows for searching and filtering for the new enironment.
Comparing Environments
From the main page it is possible to compare different environments using the environment selector. Selecting multiple environments in the check box will query the server for the plots with the same titles in all environments and plot them in a single plot. An additional compare legend pane is created with a number corresponding to each selected environment. Individual plots are updated with legends corresponding to "x_name" where x is a number corresponding with the compare legend pane and name is the original name in the legend.
Note: The compare envs view is not robust to high throughput data, as the server is responsible for generating the compared content. Do not compare an environment that is receiving a high quantity of updates on any plot, as every update will request regenerating the comparison. If you need to compare two plots that are receiving high quantities of data, have them share the same window on a singular env.
Clearing Environments
You can use the eraser button to remove all of the current contents of an environment. This closes the plot windows for that environment but keeps the empty environment for new plots.
Managing Environments
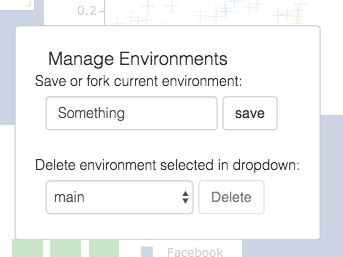
Pressing the folder icon opens a dialog that allows you to fork or force save the current environment, or delete any of your existing environments. Use of this feature is fully described in the State section.
Env Files: Your envs are loaded upon request by the user, by default from
$HOME/.visdom/. Custom paths can be passed as a cmd-line argument. Envs are removed by using the delete button or by deleting the corresponding.jsonfile from the env dir. In case you want the server to pre-load all files into cache, use the flag-eager_data_loading.
State
Once you've created a few visualizations, state is maintained. The server automatically caches your visualizations -- if you reload the page, your visualizations reappear.
- Save: You can manually do so with the
savebutton. This will serialize the env's state (to disk, in JSON), including window positions. You can save anenvprogrammatically.
This is helpful for more sophisticated visualizations in which configuration is meaningful, e.g. a data-rich demo, a model training dashboard, or systematic experimentation. This also makes them easy to share and reuse.
- Fork: If you enter a new env name, saving will create a new env -- effectively forking the previous env.
Tip: Fork an environment before you begin to make edits to ensure that your changes are saved seperately.
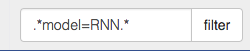
Filter
You can use the filter to dynamically sift through windows present in an env -- just provide a regular expression with which to match titles of window you want to show. This can be helpful in use cases involving an env with many windows e.g. when systematically checking experimental results.
Note: If you have saved your current view, the view will be restored after clearing the filter.
Views

It is possible to manage the views simply by dragging the tops of windows around, however additional features exist to keep views organized and save common views. View management can be useful for saving and switching between multiple common organizations of your windows.
Saving/Deleting Views
Using the folder icon, a dialog window opens where views can be forked in the same way that envs can be. Saving a view will retain the position and sizes of all of the windows in a given environment. Views are saved in $HOME/.visdom/view/layouts.json in the visdom filepath.
Note: Saved views are static, and editing a saved view copies that view over to the
currentview where editing can occur.
Re-Packing
Using the repack icon (9 boxes), visdom will attempt to pack your windows in a way that they best fit while retaining row/column ordering.
Note: Due to the reliance on row/column ordering and
ReactGridLayoutthe final layout might be slightly different than what might be expected. We're working on improving that experience or providing alternatives that give more fine-tuned control.
Reloading Views
Using the view dropdown it is possible to select previously saved views, restoring the locations and sizes of all of the windows within the current environment to the places they were when that view was saved last.
Setup
Python and web clients come bundled with the python server.
Install from pip
> pip install visdom
Install from source
> pip install git+https://github.com/fossasia/visdom
Usage
Start the server (probably in a screen or tmux) from the command line:
> visdom
Visdom now can be accessed by going to http://localhost:8097 in your browser, or your own host address if specified.
The
visdomcommand is equivalent to runningpython -m visdom.server.If the above does not work, try using an SSH tunnel to your server by adding the following line to your local
~/.ssh/config:LocalForward 127.0.0.1:8097 127.0.0.1:8097.
Command Line Options
The following options can be provided to the server:
-port: The port to run the server on.-hostname: The hostname to run the server on.-base_url: The base server url (default = /).-env_path: The path to the serialized session to reload.-logging_level: Logging level (default = INFO). Accepts both standard text and numeric logging values.-readonly: Flag to start server in readonly mode.-enable_login: Flag to setup authentication for the sever, requiring a username and password to login.-force_new_cookie: Flag to reset the secure cookie used by the server, invalidating current login cookies. Requires-enable_login.-bind_local: Flag to make the server accessible only from localhost.-eager_data_loading: By default visdom loads environments lazily upon user request. Setting this flag lets visdom pre-fetch all environments upon startup.
When -enable_login flag is provided, the server asks user to input credentials using terminal prompt. Alternatively,
you can setup VISDOM_USE_ENV_CREDENTIALS env variable, and then provide your username and password via
VISDOM_USERNAME and VISDOM_PASSWORD env variables without manually interacting with the terminal. This setup
is useful in case if you would like to launch visdom server from bash script, or from Jupyter notebook.
```bash
VISDOM_USERNAME=username
VISDOM_PASS
Core symbols most depended-on inside this repo
getShape
Languages
Modules by API surface
Used by 2 indexed graphs manifest dependencies, hub-wide
Dependencies from manifests, versioned
For agents
$ claude mcp add visdom \
  -- python -m otcore.mcp_server <graph>