github.com/dimonomid/nerdlog @v1.10.0
Chat with this repoWhat it actually does AI analysis from the code graph — generated when you open this
README
Nerdlog
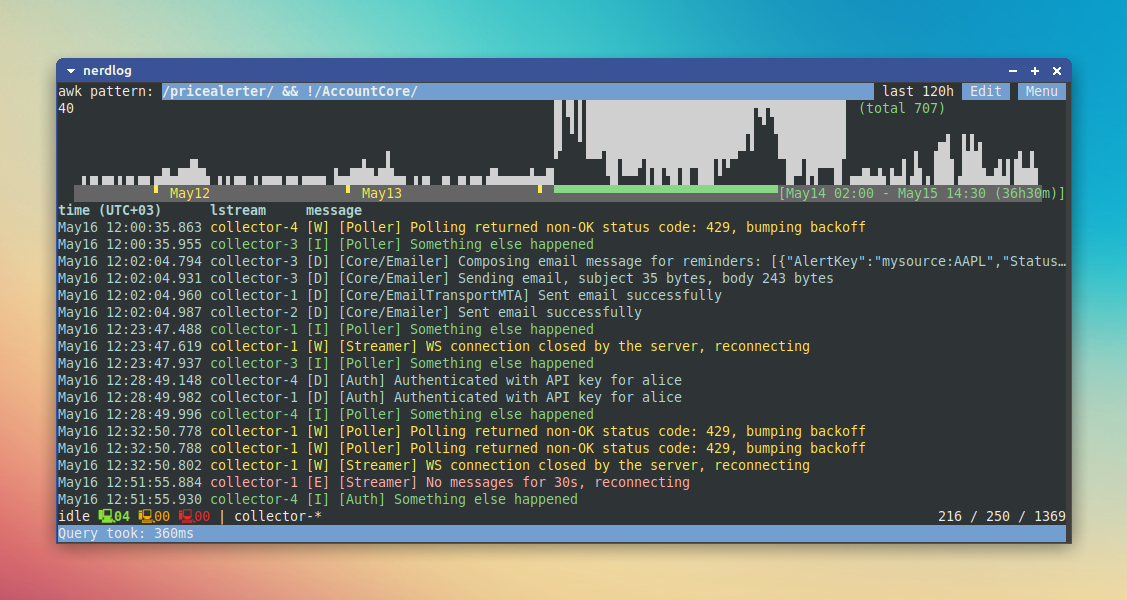
Nerdlog is a fast, remote-first, multi-host TUI log viewer with timeline histogram and no central server. Loosely inspired by Graylog/Kibana, but without the bloat. Pretty much no setup needed, either.
It's laser-focused on being efficient while querying logs from multiple remote machines simultaneously, filtering them by time range and patterns, while also drawing an interactive timeline histogram for quick visual insight.
Primary use case: reading system logs (from the files /var/log/messages or
/var/log/syslog, or straight from journalctl) from one or more remote
hosts. Very efficient even on large log files (like 1GB or more).
It does support some other log formats and can use any log files, but that was the primary use case which was driving the implementation: we were having our web service backend running as systemd services on a bunch of Linux instances, printing a lot of logs, and wanted to be able to read these logs efficiently and having the timeline histogram, much like tools like Graylog have.
Design highlights
- No centralized server required; nerdlog establishes an ssh connection to every node that the user wants to collect logs from, and keeps them idle in the background (although a separate server to store the log files might still help in some cases; see the Limitations section in the docs);
- Logs are not downloaded to the local machine in full: all the log analysis is done on the remote nodes, and on each query, only the following data is downloaded from each node: up to 250 messages from every logstream (configurable), and data for the timeline histogram. It's obviously possible to paginate over the logs, to get the next bunch of messages, etc. Nerdlog then merges the responses from all nodes together, and presents to the user in a unified form;
- Most of the data is gzipped in transit, thus saving the bandwidth as well.
Demo
Here’s a quick demo showing how Nerdlog works across four remote nodes:

Project history
It might be useful to know the history to understand the project motivation and overall direction, you can read it in the article: Implementing a Radically Simple Alternative to Graylog.
Project state
Originally hacked together in 2022 to replace painfully slow Splunk setups. Revisited in 2025 to clean it up to a certain extent, and open source it.
Tested on various Linux distros, FreeBSD, MacOS and Windows (only the client app can run on Windows though, we can't get logs from Windows hosts).
The code still has some traces of the hackathon style here and there, and could be more polished, but overall it matured significantly. There are decent tests as well.
I've been using it at work and for my personal projects for a few years now, and I consider it ready to be used in the wild on production systems.
Installation
The easiest is to just use a prebuilt binary for your platform, see the releases page.
To build it from source, you need Go.
Also on Linux, the X11 dev package is required because of access to clipboard (here's the library that nerdlog uses), e.g. on Ubuntu it can be installed with this:
sudo apt install libx11-dev
On MacOS and Windows, no extra dependencies are required.
Using go install
Latest release (might miss newest features which are not yet officially released):
go install github.com/dimonomid/nerdlog/cmd/nerdlog@latest
Latest master:
go install github.com/dimonomid/nerdlog/cmd/nerdlog@master
Unless you have custom GOPATH or GOBIN env vars set, it will install the
nerdlog binary to $HOME/go/bin.
Using make
To install nerdlog binary to your /usr/local/bin:
$ make && sudo make install
Or to build and run without installing:
$ make && bin/nerdlog
Usage
When you open the app (nerdlog binary), it'll show a query edit form with a
few fields:

Time range is self-explanatory.
Next one is "Logstreams": shortly, as the name suggests, a logstream is a contiguous stream of log messages, on a particular server accessible via ssh (or on the local server). As of now, two kinds of logstreams are supported:
- One or more consecutive log files like
/var/log/syslogand/var/log/syslog.1(actually as of now there can be at most 2 files in a logstream, but this limitation will hopefully be removed). - Logs returned from
journalctl
By default, nerdlog checks available logstreams in the following order:
- If available, use the
/var/log/messagesfile (and the older/var/log/messages.1) - If available, use the
/var/log/syslogfile (and the older/var/log/syslog.1) - As the last resort, use
journalctlif available.
Why preferring the logfiles instead of journalctl: shortly, because it's less
reliable and much slower. See
FAQ
for details. However, journalctl is more universally available these days
(alas), and it often also has longer history, so nerdlog has full support for
it. So far there's no option to prefer journalctl instead of log files by
default, lmk if you need it; shouldn't be hard to implement.
So if you have a server like myserver.com accessible via ssh on port 22, then
the logstream to read its /var/log/messages file (or /var/log/syslog file,
or from journalctl if none of these files are present) could be:
myuser@myserver.com
If you need a different port and/or different log files, then a more explicit form is:
myuser@myserver.com:1234:/some/other/logfile
To select journalctl explicitly, specify journalctl as the log file:
myuser@myserver.com:1234:journalctl
Multiple logstreams can be provided separated by commas, like this:
myuser@myserver.com, myuser@myserver.com:1234:/some/other/logfile
Nerdlog also reads ssh config (~/.ssh/config) and can take the port, username
and hostname from there. It supports globs too, so e.g. in your ssh config you
have two hosts like myhost-01 and myhost-02, then instead of specifying
your logstreams as myhost-01,myhost-02 it can be simply myhost-*.
Obviously though, we can't specify the log files in the ssh config, so if you
need to configure a logstream for non-default log file on some host(s), you can
use the nerdlog's own logstreams config file ~/.config/nerdlog/logstreams.yaml,
which can look like this:
log_streams:
  myhost-01:
    hostname: actualhost1.com
    port: 1234
    user: myuser
    log_files:
      - /some/custom/logfile
  myhost-02:
    hostname: actualhost2.com
    port: 7890
    user: myuser
    log_files:
      - /some/custom/logfile
The last thing on that query form is the "Select field expression", it looks like this:
time STICKY, lstream, message, *
It only affects the presentation of the logs in the UI. The syntax somewhat
resembles the SQL SELECT syntax, although a lot more limited.
The STICKY here just means that when the table is scrolled to the right,
these sticky columns will remain visible at the left side.
Another supported keyword here is AS, so e.g. message AS msg is a valid
syntax.
For a more extensive discussion on the logstreams and other core concepts, and advanced options like using sudo to read log files, consider
reading the Core concepts section in the docs.
Requirements
- SSH access to the hosts is required (except for
localhost). You can read about the related limitations and possible workarounds here: Consequences of requiring SSH access; - Gawk (GNU awk) is a requirement on the hosts, since nerlog relies on the
-boption. So notably,mawkwill not work. You needgawk;
For more details, see Requirements and Limitations in the docs.
UI
UI consists of a few key elements:
- Awk pattern input: just a filter for logs. Empty filter obviously means no filter, and some examples of valid filters are:
- Simple regexp:
/foo bar/ - Regexps with complex conditions:
( /foo bar/ || /other stuff/ ) && !/baz/ - Edit button: opens a complete query edit form discussed above.
- Menu button: just opens a menu with a few extra items:
- Back: Go to the previous query, just like in the browser
- Forward: Go to the next query, just like in the browser
-
Copy query command: It's the equivalent of copying an URL in the browser, containing the link to the current logs query. See the
:xc[lip]command below for more details on that. -
Time range histogram: similarly to some web-based log viewers, like Graylog or Kibana, Nerdlog also shows a timeline histogram, so you can quickly glance at the intensiveness of the logs accordingly to the current query. It's also easy to visually select and apply timerange (using arrow / PgUp / PgDown / Home / End / Enter keys or vim-like bindings)
- Logs table: obviously contains the actual logs. Like in the normal, old-school logs, the latest message is on the bottom. I don't know why modern web tools do it the other way around (latest message being on the top), to me it's nonsense. But let me know if you prefer it this modern way; it shouldn't be too hard to make it configurable.
Every line shows the timestamp and the message, and it can also be scrolled to the right to show the context tags parsed from a log line.
- Status line. On the left side, there are a few computer icons with numbers:
- Green: number of lstreams which we're fully connected to and which are idle
- Orange: number of lstreams which we're fully connected to and which are executing a query
- Red: number of lstreams which we're trying to connect to
And on the right side, there are 3 numbers like 1201 / 1455 / 2948122. The rightmost number (2948122) is the total number of log messages that matched the query and the timerange (and included in the timeline histogram above). The next number (1455) is the number of actual log lines currently loaded in the nerdlog app, and the leftmost (1201) is just the cursor within those available logs.
- Command line: Vim-like command line. Hit
:to enter command mode.
Navigation
There are multiple ways to navigate the app, and you can mix them as you wish.
The most conventional one is to just use Tab and Shift+Tab to switch between widgets (logs table, query input, Edit and Menu buttons, timeline histogram), arrows and keys like Home / End / PgUp / PgDn to move around within a widget, Enter to apply things, Escape to cancel things.
Some browser-like keyboard shortcuts are also supported (after all, one of the inspirations for Nerdlog were browser-based tools like Graylog):
Alt+Left: Go back in historyAlt+Right: Go forward in historyF5orCtrl+R: Refresh (i.e. rerun the same query again)Shift+F5orAlt+Ctrl+R: Hard refresh, i.e. also rebuild the index for every logstream (the index is only relevant for plain log files; so forjournalctl-powered logstreams, it's the same as regular Refresh)
If you know Vim though, you'll feel right at home in nerdlog too since it supports a bunch of Vim-like keybindings:
- Keys
h,j,k,l,g,G,Ctrl+U,Ctrl+D, etc move cursor whenever you're not in some text-editing field, like query input or others - Hitting Escape eventually brings you to the "Normal mode", which means that the logs table is focused (and all of those
h,j,k,l, etc work there) :focuses the command line where you can input some commands (see below)iorafocuses the main query input field
When in an input field (command line, query input, etc), you can go through input history using Up / Down or Ctrl+P / Ctrl+N.
In the query edit form (the Edit button on the UI, or the :e[dit] command), the Ctrl+K / Ctrl+J iterates "full" query history (affecting not only one field like query, but all of them: time range, logstreams filter, query).
Commands
In addition to the UI which is self-discoverable, there is a vim-like command line with a few commands supported.
:xc[lip] Copies to clipboard a command string which would open nerdlog with
the current logstreams filter, time range and query. This can be done from the Menu too (Menu -> Copy query command)
This is the equivalent of URL sharing for web-based logging tools: when you'd normally copy the graylog URL and paste it in slack somewhere, with nerdlog you can do the same by sharing this string.
The string would look like this:
nerdlog --lstreams 'localhost' --time -3h --pattern '/something/'
And it can be used in either the shell (which would open a new instance of
nerdlog), OR it can also be used in a currently running nerdlog instance: just
type : to go to the command mode, copypaste this command above, and nerdlog
will parse it and apply the query.
:back or :prev Go to the previous query, just like in the browser. This can be done from the Menu too (Menu -> Back), or using a keyboard shortcut Alt+Left.
:fwd or :next Go to the next query, just like in the browser. This can be done from the Menu too (Menu -> Forward), or using a keyboard shortcut Alt+Right.
:e[dit] Open query edit form; you can do the same if you just use Tab to navigate
to the Edit button in the UI.
:w[rite] [filename] Write all currently loaded log lines to the filename.
If filename is omitted, /tmp/last_nerdlog is used.
:refresh Rerun the same query again. This can be done from the Menu too (Menu -> Refr
Extension points exported contracts — how you extend this code
ShellTransport (Interface)Core symbols most depended-on inside this repo
ErrorfShape
Languages
Modules by API surface
For agents
$ claude mcp add nerdlog \
  -- python -m otcore.mcp_server <graph>