github.com/datarootsio/tf-profile @v0.5.0
Chat with this repoWhat it actually does AI analysis from the code graph — generated when you open this
README
tf-profile



CLI tool to profile Terraform runs, written in Go.
Main features: - Modern CLI (cobra-based) with autocomplete - Read logs straight from your Terraform process (using pipe) or a log file - Can generate global stats, resource-level stats or visualizations - Provides many levels of granularity and aggregation and customizable outputs
Featured on: awesome-go | awesome-terraform
Installation
Brew install
❱ brew tap datarootsio/tf-profile
❱ brew install tf-profile
❱ tf-profile --help
tf-profile is a CLI tool to profile Terraform runs

Usage:
  tf-profile [command]
Binary download
- Head over to the releases page (https://github.com/QuintenBruynseraede/tf-profile/releases)
- Download the correct binary for your operating system
- Copy it to a path that is on your
$PATH. On a Linux system,/usr/local/binis the most common location.
Using docker
If you want to try tf-profile without installing anything, you can run it using Docker (or similar).
❱ cat my_log_file.log | docker run -i qbruynseraede/tf-profile:0.5.0 stats

Key                                Value
Number of resources created        1510

Cumulative duration                36m19s
Longest apply time                 7m18s
Longest apply resource             time_sleep.foo[*]
...
Optionally, define an alias:
❱ alias tf-profile=docker run -i qbruynseraede/tf-profile:0.5.0
❱ cat my_log_file.log | tf-profile
Build from source
This requires at least version 1.23 of the go cli.
❱ git clone git@github.com:QuintenBruynseraede/tf-profile.git
❱ cd tf-profile && go build .
❱ sudo ln -s $(pwd)/tf-profile /usr/local/bin  # Optional: only if you want to run tf-profile from other directories
❱ tf-profile --help
tf-profile is a CLI tool to profile Terraform runs

Usage:
  tf-profile [command]
Basic usage
tf-profile handles input from stdin and from files. These two commands are therefore equivalent:
❱ terraform apply -auto-approve | tf-profile table
❱ terraform apply -auto-approve > log.txt && tf-profile table log.txt
Four major commands are supported:
- 🔗 tf-profile stats: provide general statistics about a Terraform run
- 🔗 tf-profile table: provide detailed, resource-level statistics about a Terraform run
- 🔗 tf-profile filter: filter logs to include only certain resources
- 🔗 tf-profile graph: generate a visual overview of a Terraform run.
tf-profile stats
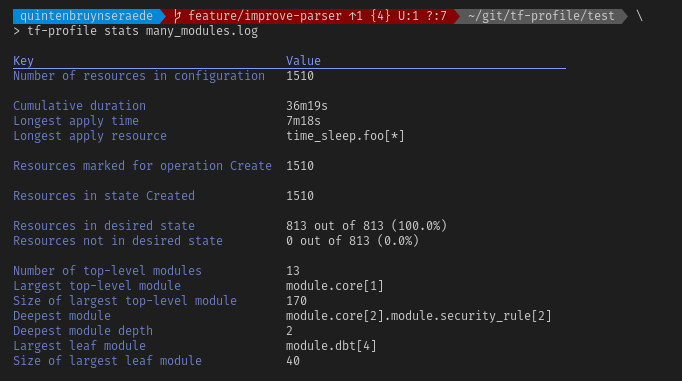
tf-profile stats is the most basic command. Given a Terraform log, it will only provide high-level statistics.
❱ terraform apply -auto-approve > log.txt
❱ tf-profile stats log.txt

Key                                Value
-----------------------------------------------------------------
Number of resources in configuration        1510

Cumulative duration                         36m19s
Longest apply time                          7m18s
Longest apply resource                      time_sleep.foo[*]

Resources marked for operation Create       892
Resources marked for operation None         18
Resources marked for operation Replace      412

Resources in state AllCreated               800
Resources in state Created                  695
Resources in state Started                  15

Resources in desired state                  1492 out of 1510 (98.8%)
Resources not in desired state              18 out of 1510 (0.01%)

Number of top-level modules                 13
Largest top-level module                    module.core[2]
Size of largest top-level module            170
Deepest module                              module.core[2].module.role[47]
Deepest module depth                        2
Largest leaf module                         module.dbt[4]
Size of largest leaf module                 40
For more information, refer to the reference for the stats command.
tf-profile table
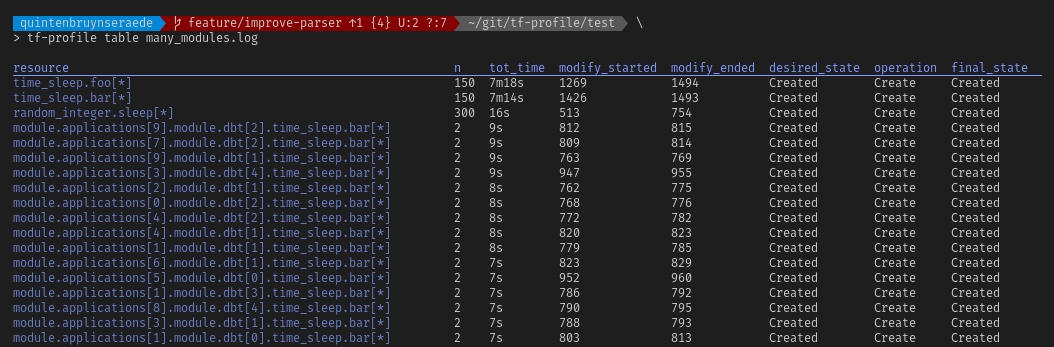
tf-profile table will parse a log and provide per-resource metrics.
❱ terraform apply -auto-approve > log.txt
❱ tf-profile table log.txt

resource              n  tot_time  modify_started  modify_ended  desired_state  operation  final_state
aws_ssm_parameter.p6  1  0s        6               7             Created        Replace    Created
aws_ssm_parameter.p1  1  0s        7               5             Created        Replace    Created
aws_ssm_parameter.p3  1  0s        5               6             Created        Replace    Created
aws_ssm_parameter.p4  1  0s        /               1             NotCreated     Destroy    NotCreated
aws_ssm_parameter.p5  1  0s        4               4             Created        Modify     Created
aws_ssm_parameter.p2  1  0s        /               /             Created        None       Created
For a full description of the options, see the reference page.
tf-profile filter
tf-profile filter filters logs to include only certain resources. Wildcards are supported to filter on multiple resources.
❱ tf-profile filter "module.*.null_resource.*" log.txt

  # module.mod1.null_resource.foo will be created
  + resource "null_resource" "foo" {
    ...
    }

  # module.mod2.null_resource.bar will be created
  + resource "null_resource" "bar" {
    ...
    }

module.mod1.null_resource.foo: Creating...
module.mod2.null_resource.bar: Creating...
module.mod1.null_resource.foo: Creation complete after 1s [id=foo]
module.mod2.null_resource.bar: Creation complete after 1s [id=bar]
For a full description of the options, see the reference page.
tf-profile graph
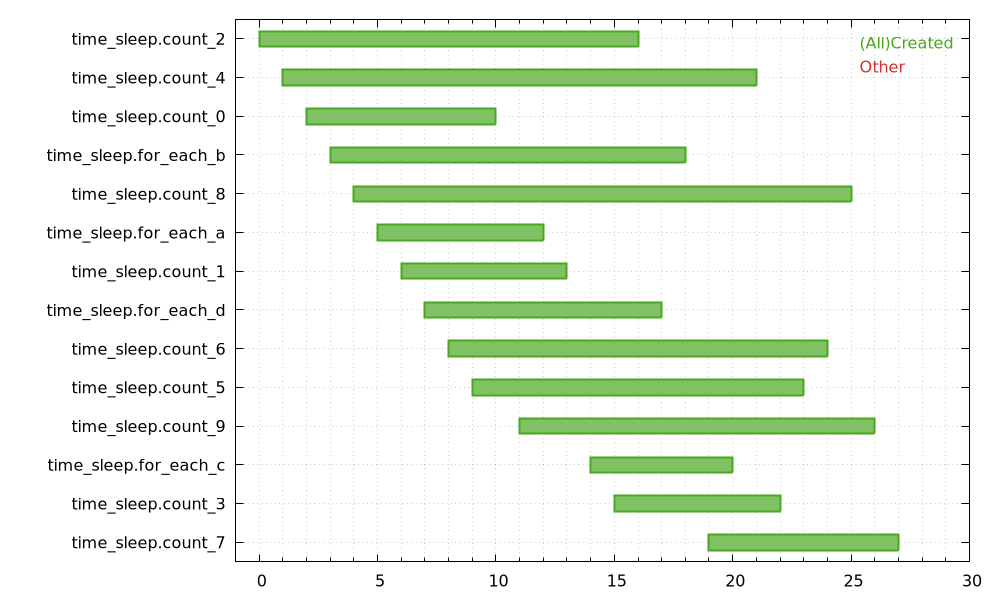
tf-profile graph is used to visualize your terraform logs. It generates a Gantt-like chart that shows in which order resources were created. tf-profile does not actually create the final image, but generates a script file that Gnuplot understands.
❱ tf-profile graph my_log.log --out graph.png --size 2000,1000 | gnuplot
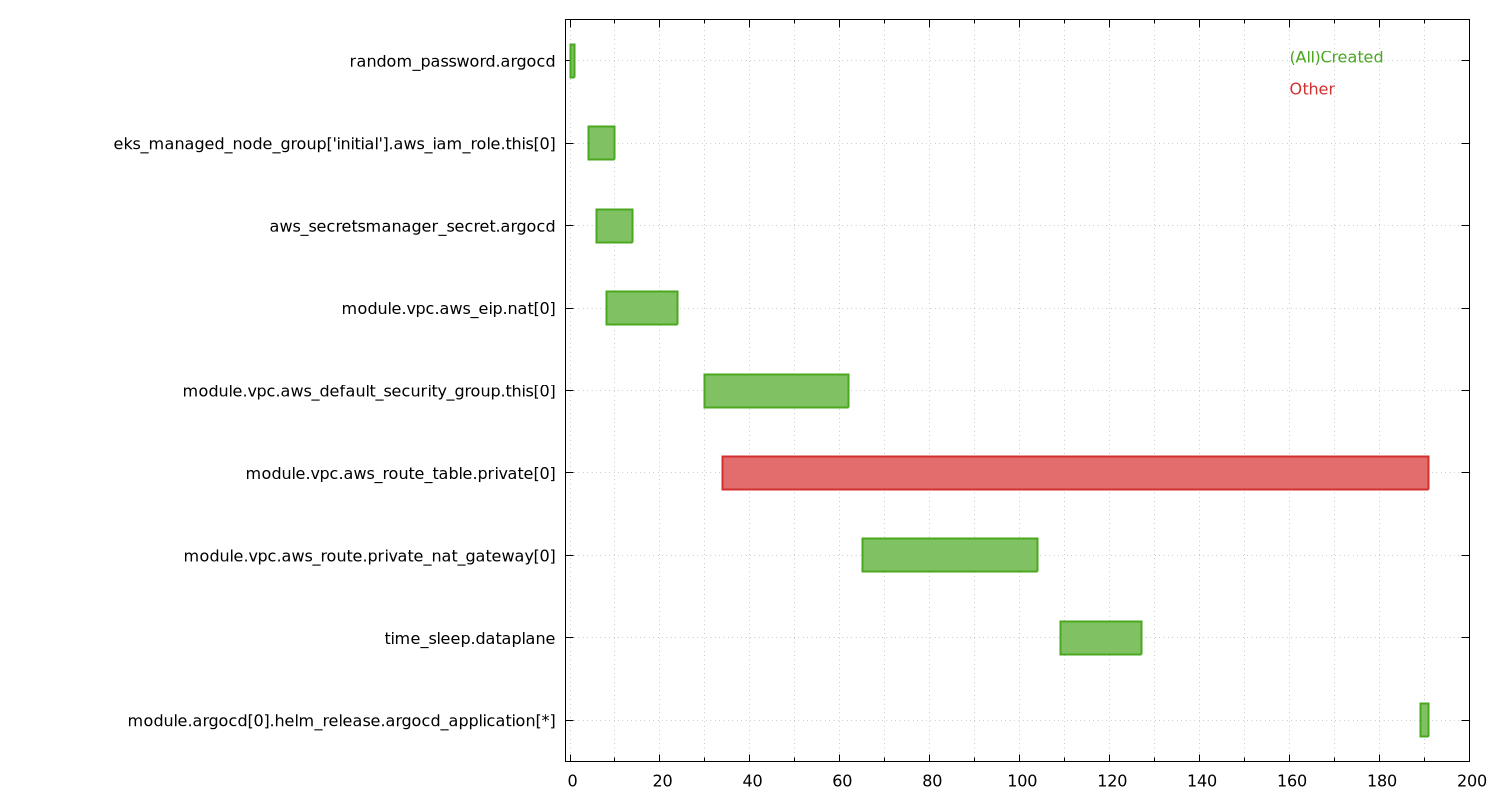
Disclaimer: Terraform's logs do not contain any absolute timestamps. We can only derive the order in which resources started and finished their modifications. Therefore, the output of tf-profile graph gives only a general indication of how long something actually took. In other words: the X axis is meaningless, apart from the fact that it's monotonically increasing.
Screenshots
Extension points exported contracts — how you extend this code
Reader (Interface)Core symbols most depended-on inside this repo
canAggregateShape
Languages
Modules by API surface
For agents
$ claude mcp add tf-profile \
  -- python -m otcore.mcp_server <graph>