github.com/criteo/cassandra_exporter @2.3.8
Chat with this repoBrowse by type
What it actually does AI analysis from the code graph — generated when you open this
README
Cassandra Exporter 

Description
Cassandra exporter is a standalone application which exports Apache Cassandra® metrics throught a prometheus friendly endpoint. This project is originally a fork of JMX exporter but aims at an easier integration with Apache Cassandra®.
Specifically, this project brings : - [x] Exporting EstimatedHistogram metrics specific to Apache Cassandra® - [x] Filtering on mbean's attributes - [x] Metrics naming that respect the mbean hierarchy - [x] Comprehensive config file
An essential design choice the project makes is to not let prometheus drive the scraping frequency. This decision has been taken because a lot of Apache Cassandra® metrics are expensive to scrap and can hinder the performance of the node. As we don't want this kind of situation to happen in production, the scrape frequency is restricted via the configuration of Cassandra Exporter.
Design explanation
The project has two focus: safety and maintainability.
Every time a tradeoff had to be made, the solution that prioritize one of those points got the advantage
Why not provide the exporter as an agent for cassandra ?
- Safety: The agent share the same jvm than cassandra itself and I don't want metrics calls to be able to hammer down cassandra nodes.
- Safety: If there is a bug/leak in the exporter itself it should not impact cassandra
- Maintainability: Upgrading the exporter should not require to restart the cassandra cluster
Why cache metrics results, this is not the prometheus way ?
- Safety: JMX is an heayweight RPC mechanism and some cassandra metrics calls are expensive to scrap (i.e: snapshots size) as they trigger some heavy operations for cassandra. Not caching results mean that you can bring down your nodes by just requesting the metrics page
Why not make more use of labels, be more prometheus way ?
- Maintainability: I want the exporter to be able to support multiple version of cassandra (2.2.X/3.X/4.X) without having to hand tune the metrics labels for each version of cassandra. Metrics path change between versions of cassandra and I want to avoid the hustle of having to maintain the mapping
Why this exporter is slower than jmx_exporter ?
- Maintainability: When your cluster grow in number of nodes, the cardinality of metrics start to put too much pressure on Prometheus itself. A lot of this cardinality is due to the not too much usefulness of metrics like 999thpercentile and others. This exporter let you choose to not export them, which is not possible with jmx_exporter, but at the cost of a small runtime penality in order to discover them. So this exporter let you reach a bigger scale before you have to rely on metric aggregation in order to scale more.
Unless you have hundreds of tables, the scrap time will stay below 10sec
Why the exporter is not written in GO ?
- Cassandra metrics are only available trought JMX, which in turn is only accessible with Java.
How to use
To start the application
java -jar cassandra_exporter.jar config.yml
The Cassandra exporter needs to run on every Cassandra nodes to get all the informations regarding the whole cluster.
You can have a look at a full configuration file here The 2 main parts are : 1. blacklist 1. maxScrapFrequencyInSec
In the blacklist block, you specify the metrics you don't want the exporter to scrape. This is important as JMX is an RPC mechanism and you don't want to trigger some of those RPC. For example, mbeans endpoint from org:apache:cassandra:db:.* does not expose any metrics but are used to trigger actions on Cassandra's nodes.
In the maxScrapFrequencyInSec, you specify the metrics you want to be scraped at which frequency.
Basically, starting from the set of all mbeans, the blacklist is applied first to filter this set and then the maxScrapFrequencyInSec is applied as a whitelist to filter the resulting set.
As an example, if we take as input set the metrics {a, b, c} and the config file is
blacklist:
  - a
maxScrapFrequencyInSec:
  50:
    - .*
  3600:
    - b
Cassandra Exporter will have the following behavior:
1. The metrics matching the blacklisted entries will never be scraped, here the metric a won't be available
1. In reverse order of frequency the metrics matching maxScrapFrequencyInSec will be scraped
1. Metric b will be scraped every hour
1. Remaining metrics will be scrapped every 50s, here only c
Resulting in :
| Metric | Scrap Frequency |
|---|---|
| a | never |
| b | every hour |
| c | every 50 seconds |
Once started the prometheus endpoint will be available at localhost:listenPort/ or localhost:listenPort/metrics and metrics format will look like the one below
cassandra_stats{name="org:apache:cassandra:metrics:table:biggraphite:datapoints_5760p_3600s_aggr:writelatency:50thpercentile",} 35.425000000000004
How to debug
Run the program with the following options:
java -Dorg.slf4j.simpleLogger.defaultLogLevel=trace -jar cassandra_exporter.jar config.yml --oneshot
You will get the duration of how long it took to scrape individual MBean, this is useful to understand which metrics are expansive to scrape.
Goods sources of information to understand what Mbeans are doing/create your dashboards are: 1. https://cassandra.apache.org/doc/latest/operating/metrics.html 1. https://github.com/apache/cassandra/tree/trunk/src/java/org/apache/cassandra/metrics 1. http://thelastpickle.com/blog/2017/12/05/datadog-tlp-dashboards.html 1. https://www.youtube.com/watch?v=Q9AAR4UQzMk
Config file example
host: localhost:7199
ssl: False
user:
password:
listenAddress: 0.0.0.0
listenPort: 8080
# Regular expression to match environment variables that will be added
# as labels to all data points. The name of the label will be either
# $1 from the regex below, or the entire environment variable name if no match groups are defined
#
# Example:
# additionalLabelsFromEnvvars: "^ADDL\_(.*)$"
additionalLabelsFromEnvvars:
blacklist:
   # Unaccessible metrics (not enough privilege)
   - java:lang:memorypool:.*usagethreshold.*

   # Leaf attributes not interesting for us but that are presents in many path (reduce cardinality of metrics)
   - .*:999thpercentile
   - .*:95thpercentile
   - .*:fifteenminuterate
   - .*:fiveminuterate
   - .*:durationunit
   - .*:rateunit
   - .*:stddev
   - .*:meanrate
   - .*:mean
   - .*:min

   # Path present in many metrics but uninterresting
   - .*:viewlockacquiretime:.*
   - .*:viewreadtime:.*
   - .*:cas[a-z]+latency:.*
   - .*:colupdatetimedeltahistogram:.*

   # Mostly for RPC, do not scrap them
   - org:apache:cassandra:db:.*

   # columnfamily is an alias for Table metrics in cassandra 3.x
   # https://github.com/apache/cassandra/blob/8b3a60b9a7dbefeecc06bace617279612ec7092d/src/java/org/apache/cassandra/metrics/TableMetrics.java#L162
   - org:apache:cassandra:metrics:columnfamily:.*

   # Should we export metrics for system keyspaces/tables ?
   - org:apache:cassandra:metrics:[^:]+:system[^:]*:.*

   # Don't scrape us
   - com:criteo:nosql:cassandra:exporter:.*

maxScrapFrequencyInSec:
  50:
    - .*

  # Refresh those metrics only every hour as it is costly for cassandra to retrieve them
  3600:
    - .*:snapshotssize:.*
    - .*:estimated.*
    - .*:totaldiskspaceused:.*
Docker
You can pull an image directly from Dockerhub:
docker pull criteord/cassandra_exporter:latest
Run docker in read-only mode (/tmp must be mounted as tmpfs to authorize sed on the config.yml when using dedicated env variables)
docker run -e CASSANDRA_EXPORTER_CONFIG_host=localhost:7198 --read-only --tmpfs=/tmp criteord/cassandra_exporter:latest
Kubernetes
To get an idea on how to integrate Cassandra Exporter in Kubernetes, you can look at this helm Chart.
Grafana
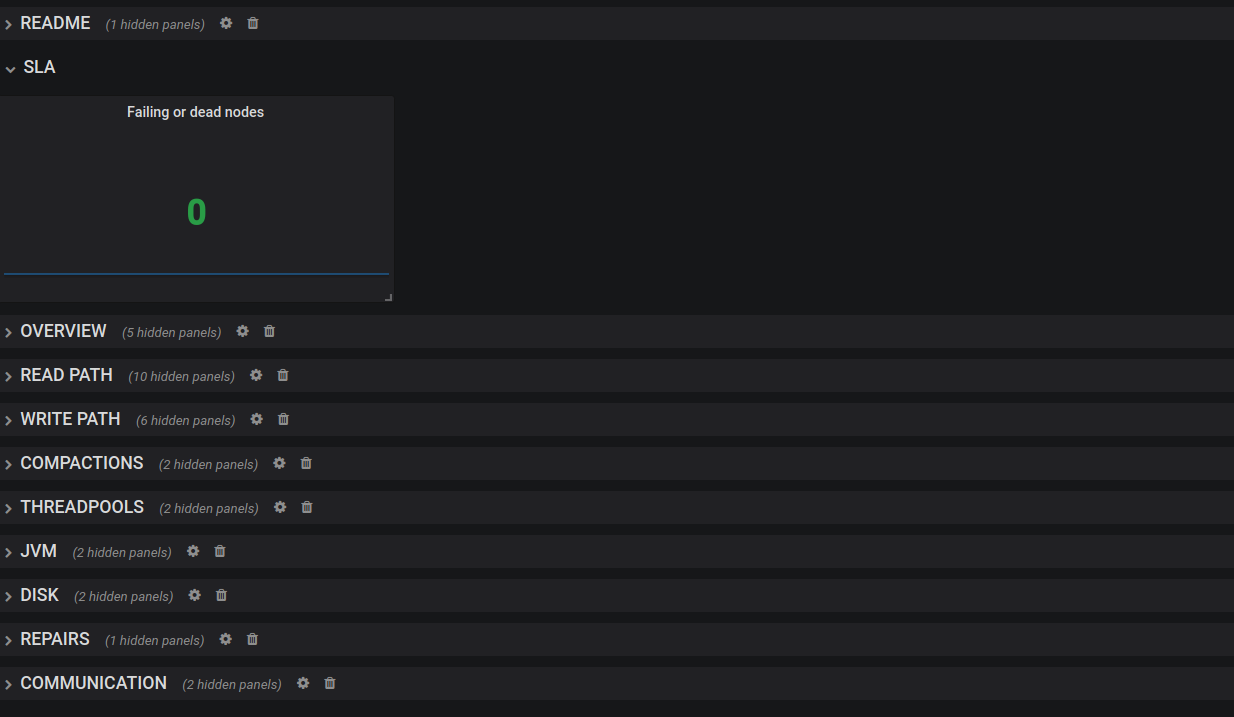
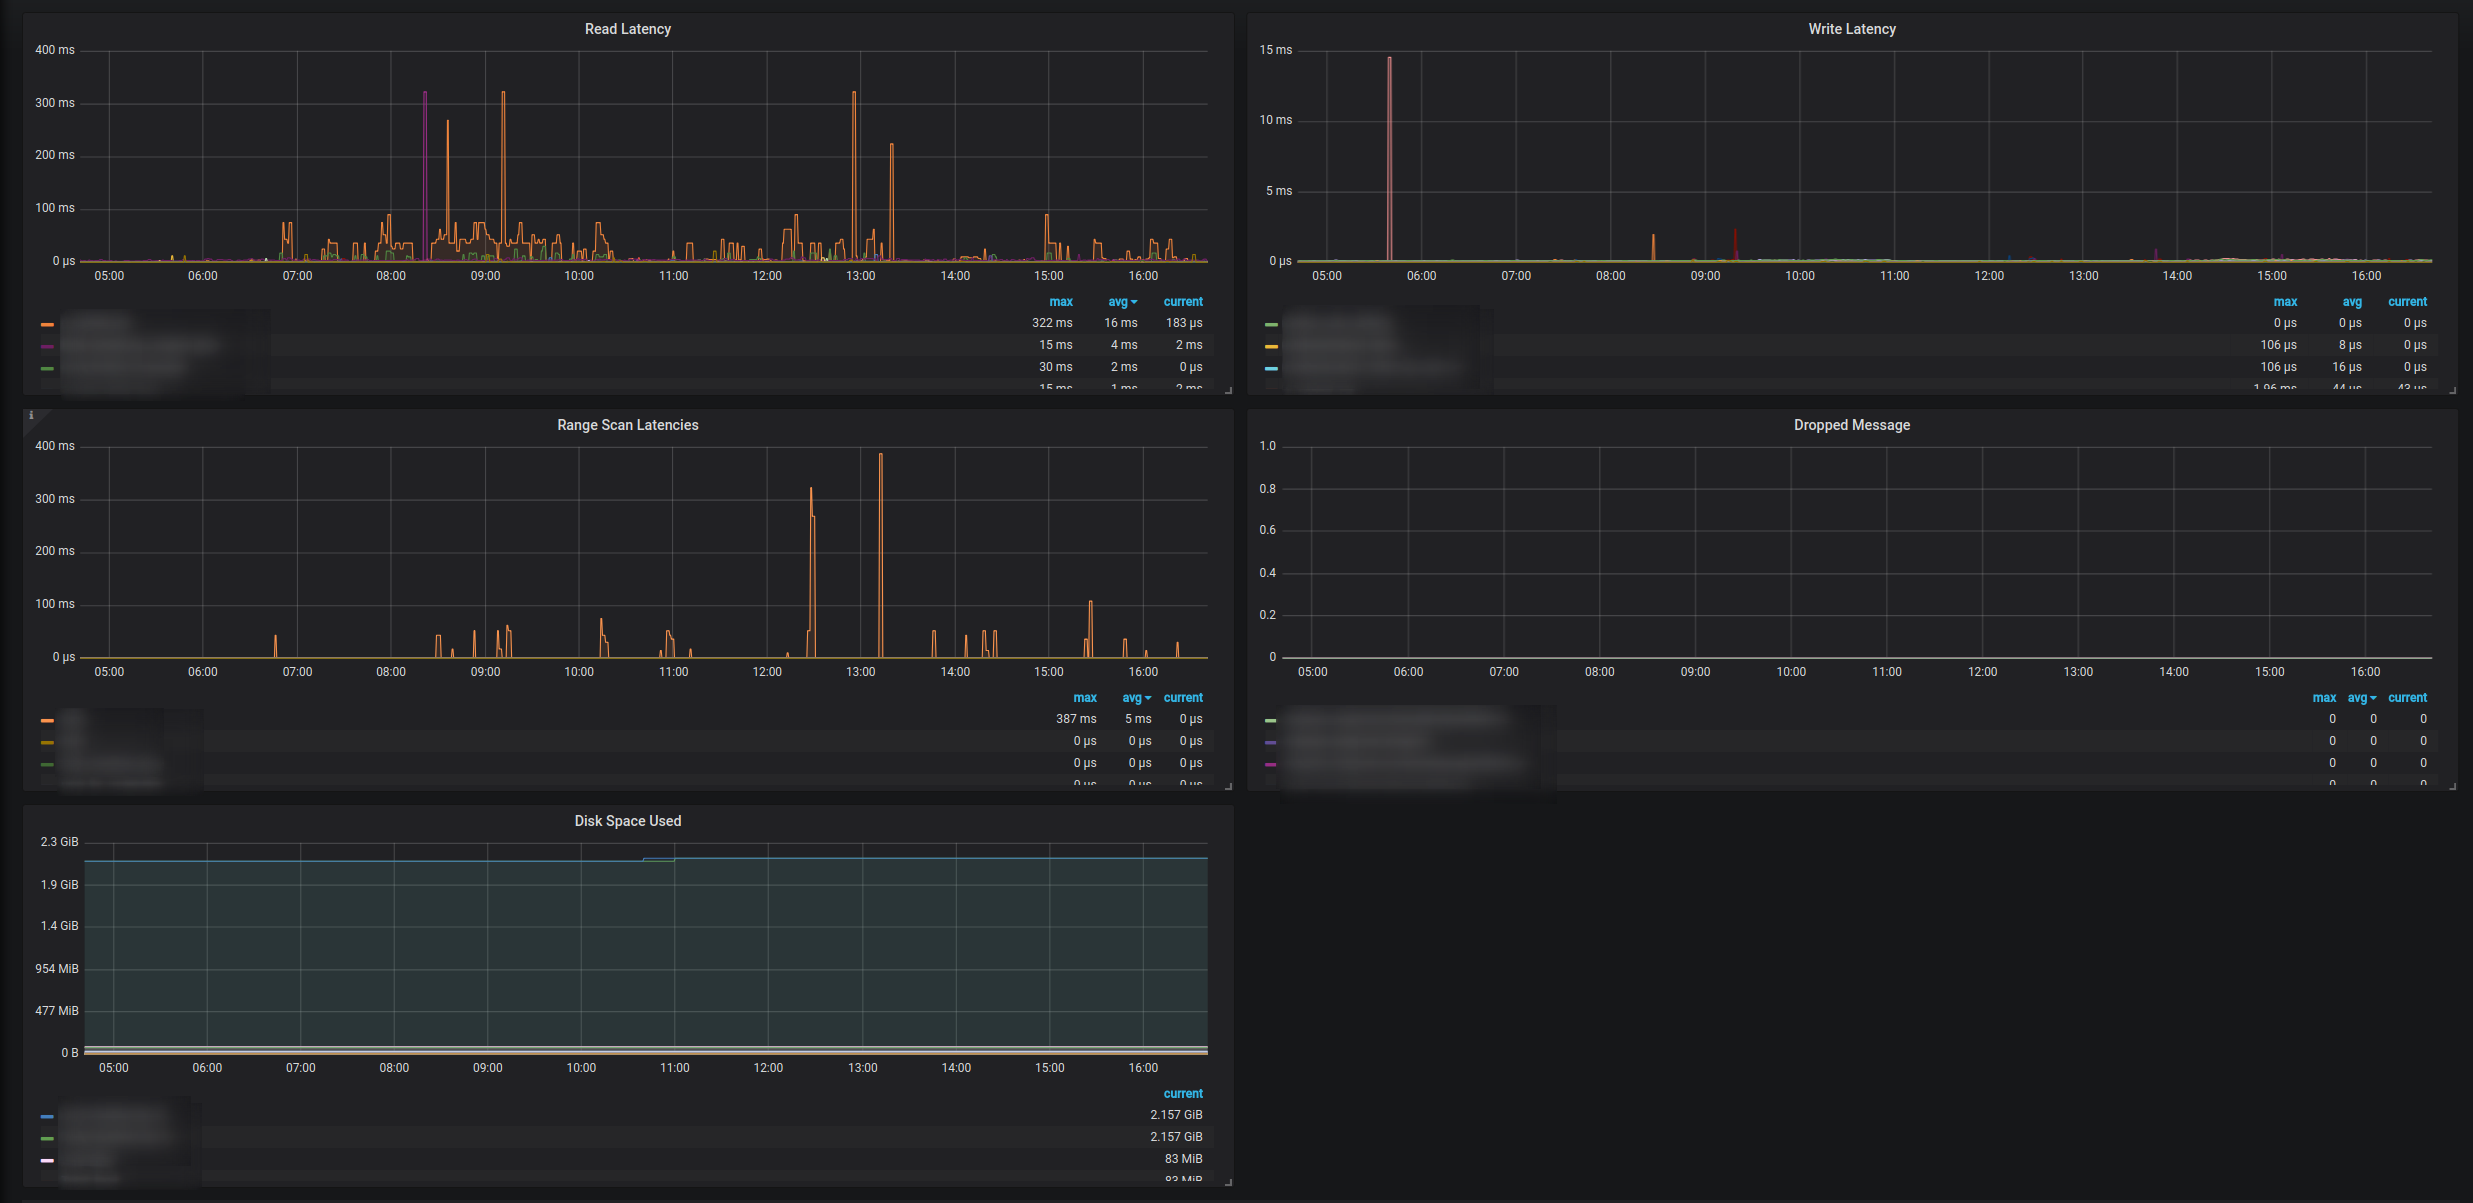
Dedicated dashboards can be found here
Core symbols most depended-on inside this repo
Shape
Languages
Modules by API surface
For agents
$ claude mcp add cassandra_exporter \
  -- python -m otcore.mcp_server <graph>