github.com/cpmech/plotpy @v1.23.0
Chat with this repoWhat it actually does AI analysis from the code graph — generated when you open this
README
Rust plotting library using Python (Matplotlib)




Contents
- Introduction
- Installation
- Arch Linux
- Debian/Ubuntu Linux
- Other systems
- Setting Cargo.toml
- Use of Jupyter via evcxr
- Examples
- Barplot
- Boxplot
- Canvas
- Contour
- Curve
- Histogram
- Image
- InsetAxes
- Surface
- Text
- Architecture
- Chaining pattern (builder style)
- Consistent conventions across all files
Introduction
This crate implements functions for generating plots and drawings in Rust. It uses Python/Matplotlib but is designed specifically for Rust developers, combining the convenience of a Rust-native API with the exceptional quality of Matplotlib 😀.
Plotpy is more verbose than native Matplotlib because the aim here is to take advantage of the intelligence of the IDE (e.g., VS Code) to auto-complete the code while developing in Rust.
Plotpy generates Python code in a temporary directory (e.g., /tmp/plotpy). It then runs the code via Python 3 using Rust's std::process::Command. The result is an image file such as SVG.
For more information (and examples), check out the plotpy documentation on docs.rs.
See also the examples directory with the output of the integration tests.
Installation
This code is mainly tested on Arch Linux and Debian/Ubuntu Linux.
This crate needs Python3 and Matplotlib.
Arch Linux
Install the dependencies:
pacman -Syu --noconfirm python-matplotlib
Debian/Ubuntu Linux
Install the dependencies:
sudo apt install python3-matplotlib
Other systems
It is possible to run plotpy in other systems where Python and Matplotlib are already installed. The Rust code calls python3 via std::process::Command. However, there is an option to call a different python executable; for instance (the code below is untested):
let mut plot = Plot::new();
plot.set_python_exe("C:\Windows11\WhereIs\python.exe")
    .add(...)
    .save(...)?;
Setting Cargo.toml

👆 Check the crate version and update your Cargo.toml accordingly:
[dependencies]
plotpy = "*"
Use of Jupyter via evcxr
Plotpy can be used with Jupyter via evcxr. Thus, it can interactively display the plots in a Jupyter Notebook. This feature requires the installation of evcxr. See the Jupyter/evcxr article.
The following code shows a minimal example (the code below is untested)
// set the python path
let python = "where-is-my/python";

// set the figure path and name to be saved
let path = "my-figure.svg";

// plot and show in a Jupyter notebook
let mut plot = Plot::new();
plot.set_python_exe(python)
    .set_label_x("x")
    .set_label_y("y")
    .show_in_jupyter(path)?;
Examples
Note, below StrError is defined as pub type StrError = &'static str; — a type alias for a static string slice. It's used throughout the library as the error type returned from functions. It's essentially a lightweight, allocation-free error type that avoids pulling in a full error-handling crate.
Barplot
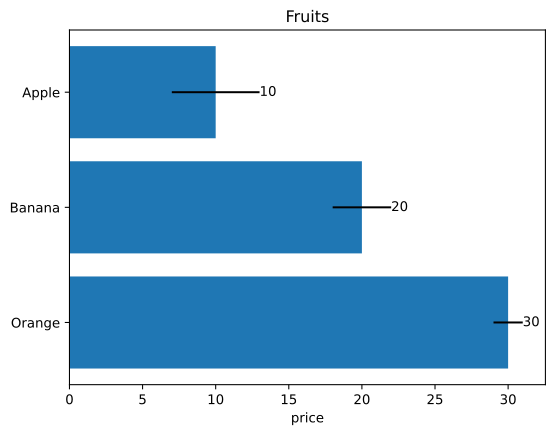
use plotpy::{Barplot, Plot, StrError};

fn main() -> Result<(), StrError> {
    // data
    let fruits = ["Apple", "Banana", "Orange"];
    let prices = [10.0, 20.0, 30.0];
    let errors = [3.0, 2.0, 1.0];

    // barplot object and options
    let mut bar = Barplot::new();
    bar.set_errors(&errors)
        .set_horizontal(true)
        .set_with_text("edge")
        .draw_with_str(&fruits, &prices);

    // save figure
    let mut plot = Plot::new();
    plot.set_inv_y()
        .add(&bar)
        .set_title("Fruits")
        .set_label_x("price");

    // plot.save("/tmp/plotpy/doc_tests/doc_barplot_3.svg")?;
    Ok(())
}
Boxplot
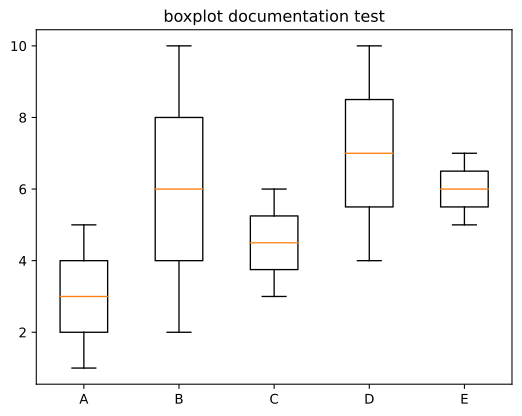
use plotpy::{Boxplot, Plot, StrError};

fn main() -> Result<(), StrError> {
    // data (as a nested list)
    let data = vec![
        vec![1, 2, 3, 4, 5],              // A
        vec![2, 3, 4, 5, 6, 7, 8, 9, 10], // B
        vec![3, 4, 5, 6],                 // C
        vec![4, 5, 6, 7, 8, 9, 10],       // D
        vec![5, 6, 7],                    // E
    ];

    // x ticks and labels
    let n = data.len();
    let ticks: Vec<_> = (1..(n + 1)).into_iter().collect();
    let labels = ["A", "B", "C", "D", "E"];

    // boxplot object and options
    let mut boxes = Boxplot::new();
    boxes.draw(&data);

    // save figure
    let mut plot = Plot::new();
    plot.add(&boxes)
        .set_title("boxplot documentation test")
        .set_ticks_x_labels(&ticks, &labels);

    // plot.save("/tmp/plotpy/doc_tests/doc_boxplot_2.svg")?;
    Ok(())
}
Canvas
use plotpy::{Canvas, Plot, PolyCode, StrError};

fn main() -> Result<(), StrError> {
    // codes
    let data = [
        (3.0, 0.0, PolyCode::MoveTo),
        (1.0, 1.5, PolyCode::Curve4),
        (0.0, 4.0, PolyCode::Curve4),
        (2.5, 3.9, PolyCode::Curve4),
        (3.0, 3.8, PolyCode::LineTo),
        (3.5, 3.9, PolyCode::LineTo),
        (6.0, 4.0, PolyCode::Curve4),
        (5.0, 1.5, PolyCode::Curve4),
        (3.0, 0.0, PolyCode::Curve4),
    ];

    // polycurve
    let mut canvas = Canvas::new();
    canvas.set_face_color("#f88989").set_edge_color("red");
    canvas.polycurve_begin();
    for (x, y, code) in data {
        canvas.polycurve_add(x, y, code);
    }
    canvas.polycurve_end(true);

    // add canvas to plot
    let mut plot = Plot::new();
    plot.add(&canvas);

    // save figure
    plot.set_range(1.0, 5.0, 0.0, 4.0)
        .set_frame_borders(false)
        .set_hide_axes(true)
        .set_equal_axes(true)
        .set_show_errors(true);

    // plot.save("/tmp/plotpy/doc_tests/doc_canvas_polycurve.svg")?;
    Ok(())
}

Contour
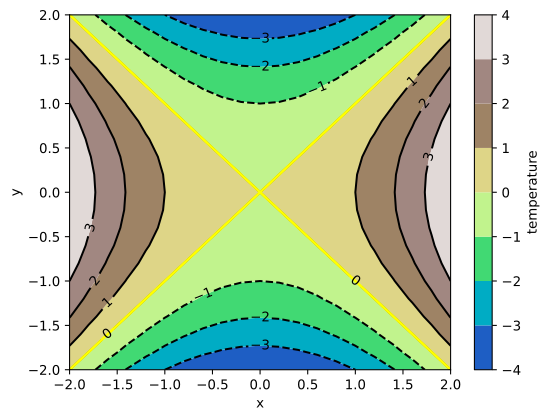
use plotpy::{generate3d, Contour, Plot, StrError};

fn main() -> Result<(), StrError> {
    // generate (x,y,z) matrices
    let n = 21;
    let (x, y, z) = generate3d(-2.0, 2.0, -2.0, 2.0, n, n, |x, y| x * x - y * y);

    // configure contour
    let mut contour = Contour::new();
    contour
        .set_colorbar_label("temperature")
        .set_colormap_name("terrain")
        .set_selected_level(0.0, true);

    // draw contour
    contour.draw(&x, &y, &z);

    // add contour to plot
    let mut plot = Plot::new();
    plot.add(&contour)
        .set_labels("x", "y");

    // plot.save("/tmp/plotpy/readme_contour.svg")?;
    Ok(())
}
Curve
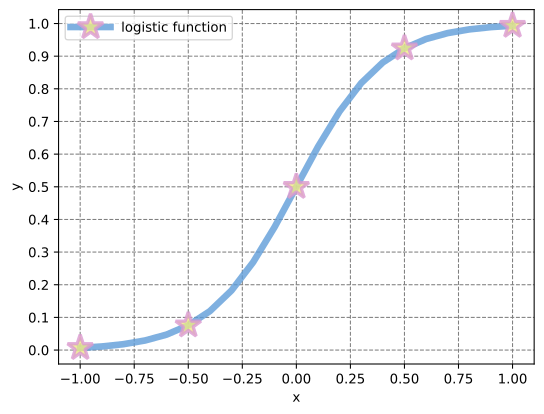
use plotpy::{linspace, Curve, Plot, StrError};

fn main() -> Result<(), StrError> {
    // generate (x,y) points
    let x = linspace(-1.0, 1.0, 21);
    let y: Vec<_> = x.iter().map(|v| 1.0 / (1.0 + f64::exp(-5.0 * *v))).collect();

    // configure curve
    let mut curve = Curve::new();
    curve
        .set_label("logistic function")
        .set_line_alpha(0.8)
        .set_line_color("#5f9cd8")
        .set_line_style("-")
        .set_line_width(5.0)
        .set_marker_color("#eeea83")
        .set_marker_every(5)
        .set_marker_line_color("#da98d1")
        .set_marker_line_width(2.5)
        .set_marker_size(20.0)
        .set_marker_style("*");

    // draw curve
    curve.draw(&x, &y);

    // add curve to plot
    let mut plot = Plot::new();
    plot.add(&curve)
        .set_num_ticks_y(11)
        .grid_labels_legend("x", "y");

    // plot.save("/tmp/plotpy/doc_tests/doc_curve.svg")?;
    Ok(())
}
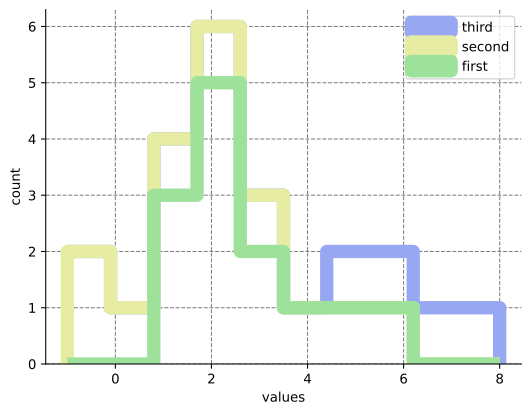
Histogram
use plotpy::{Histogram, Plot, StrError};

fn main() -> Result<(), StrError> {
    // set values
    let values = vec![
        vec![1, 1, 1, 2, 2, 2, 2, 2, 3, 3, 4, 5, 6], // first series
        vec![-1, -1, 0, 1, 2, 3],                    // second series
        vec![5, 6, 7, 8],                            // third series
    ];

    // set labels
    let labels = ["first", "second", "third"];

    // configure and draw histogram
    let mut histogram = Histogram::new();
    histogram.set_colors(&["#9de19a", "#e7eca3", "#98a7f2"])
        .set_line_width(10.0)
        .set_stacked(true)
        .set_style("step");
    histogram.draw(&values, &labels);

    // add histogram to plot
    let mut plot = Plot::new();
    plot.add(&histogram)
        .set_frame_border(true, false, true, false)
        .grid_labels_legend("values", "count");

    // plot.save("/tmp/plotpy/doc_tests/doc_histogram.svg")?;
    Ok(())
}
Image
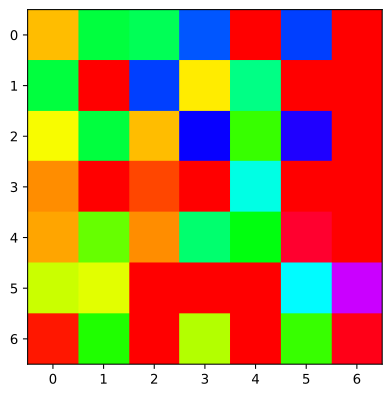
use plotpy::{Image, Plot, StrError};

fn main() -> Result<(), StrError> {
    // set values
    let data = [
        [0.8, 2.4, 2.5, 3.9, 0.0, 4.0, 0.0],
        [2.4, 0.0, 4.0, 1.0, 2.7, 0.0, 0.0],
        [1.1, 2.4, 0.8, 4.3, 1.9, 4.4, 0.0],
        [0.6, 0.0, 0.3, 0.0, 3.1, 0.0, 0.0],
        [0.7, 1.7, 0.6, 2.6, 2.2, 6.2, 0.0],
        [1.3, 1.2, 0.0, 0.0, 0.0, 3.2, 5.1],
        [0.1, 2.0, 0.0, 1.4, 0.0, 1.9, 6.3],
    ];

    // image plot and options
    let mut img = Image::new();
    img.set_colormap_name("hsv").draw(&data);

    // save figure
    let mut plot = Plot::new();
    plot.add(&img);

    // plot.save("/tmp/plotpy/doc_tests/doc_image_1.svg")?;
    Ok(())
}
InsetAxes
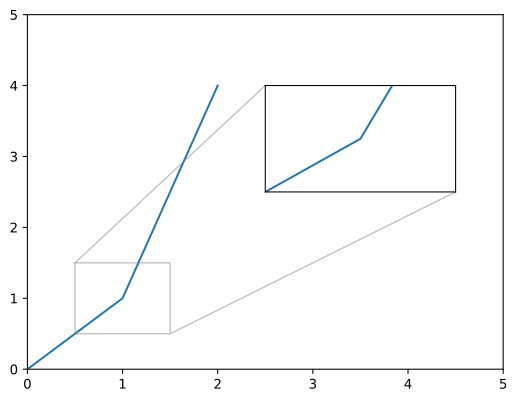
use plotpy::{Curve, InsetAxes, Plot, StrError};

fn main() -> Result<(), StrError> {
    // draw curve
    let mut curve = Curve::new();
    curve.draw(&[0.0, 1.0, 2.0], &[0.0, 1.0, 4.0]);

    // allocate inset and add curve to it
    let mut inset = InsetAxes::new();
    inset
        .add(&curve) // add curve to inset
        .set_range(0.5, 1.5, 0.5, 1.5) // set the range of the inset
        .draw(0.5, 0.5, 0.4, 0.3);

    // add curve and inset to plot
    let mut plot = Plot::new();
    plot.add(&curve)
        .set_range(0.0, 5.0, 0.0, 5.0)
        .add(&inset); // IMPORTANT: add inset after setting the range

    // plot.save("/tmp/plotpy/doc_tests/doc_inset_axes_add.svg")?;
    Ok(())
}
Surface
use plotpy::{Plot, StrError, Surface};

fn main() -> Result<(), StrError> {
    // star
    let r = &[1.0, 1.0, 1.0];
    let c = &[-1.0, -1.0, -1.0];
    let k = &[0.5, 0.5, 0.5];
    let mut star = Surface::new();
    star.set_colormap_name("jet")
        .draw_superquadric(c, r, k, -180.0, 180.0, -90.0, 90.0, 40, 20)?;

    // pyramids
    let c = &[1.0, -1.0, -1.0];
    let k = &[1.0, 1.0, 1.0];
    let mut pyramids = Surface::new();
    pyramids
        .set_colormap_name("inferno")
        .draw_superquadric(c, r, k, -180.0, 180.0, -90.0, 90.0, 40, 20)?;

    // rounded cube
    let c = &[-1.0, 1.0, 1.0];
    let k = &[4.0, 4.0, 4.0];
    let mut cube = Surface::new();
    cube.set_surf_color("#ee29f2")
        .draw_superquadric(c, r, k, -180.0, 180.0, -90.0, 90.0, 40, 20)?;

    // sphere
    let c = &[0.0, 0.0, 0.0];
    let k = &[2.0, 2.0, 2.0];
    let mut sphere = Surface::new();
    sphere
        .set_colormap_name("rainbow")
        .draw_superquadric(c, r, k, -180.0, 180.0, -90.0, 90.0, 40, 20)?;

    // sphere (direct)
    let mut sphere_direct = Surface::new();
    sphere_direct.draw_sphere(&[1.0, 1.0, 1.0], 1.0, 40, 20)?;

    // add features to plot
    let mut plot = Plot::new();
    plot.add(&star)
        .add(&pyramids)
        .add(&cube)
        .add(&sphere)
        .add(&sphere_direct);

    // save figure
    plot.set_equal_axes(true)
        .set_figure_size_points(600.0, 600.0);

    // plot.save("/tmp/plotpy/readme_superquadric.svg")?;
    Ok(())
}
Core symbols most depended-on inside this repo
addShape
Languages
Modules by API surface
For agents
$ claude mcp add plotpy \
  -- python -m otcore.mcp_server <graph>