hub / github.com/cmpolis/datacomb
github.com/cmpolis/datacomb @1.2.1
Chat with this repo
1,388 symbols
2,861 edges
15 files
284 documented · 20%
What it actually does AI analysis from the code graph — generated when you open this
loading…
README
Datacomb
An interactive tool for analyzing, exploring and combing through tabular datasets. by @ChrisPolis
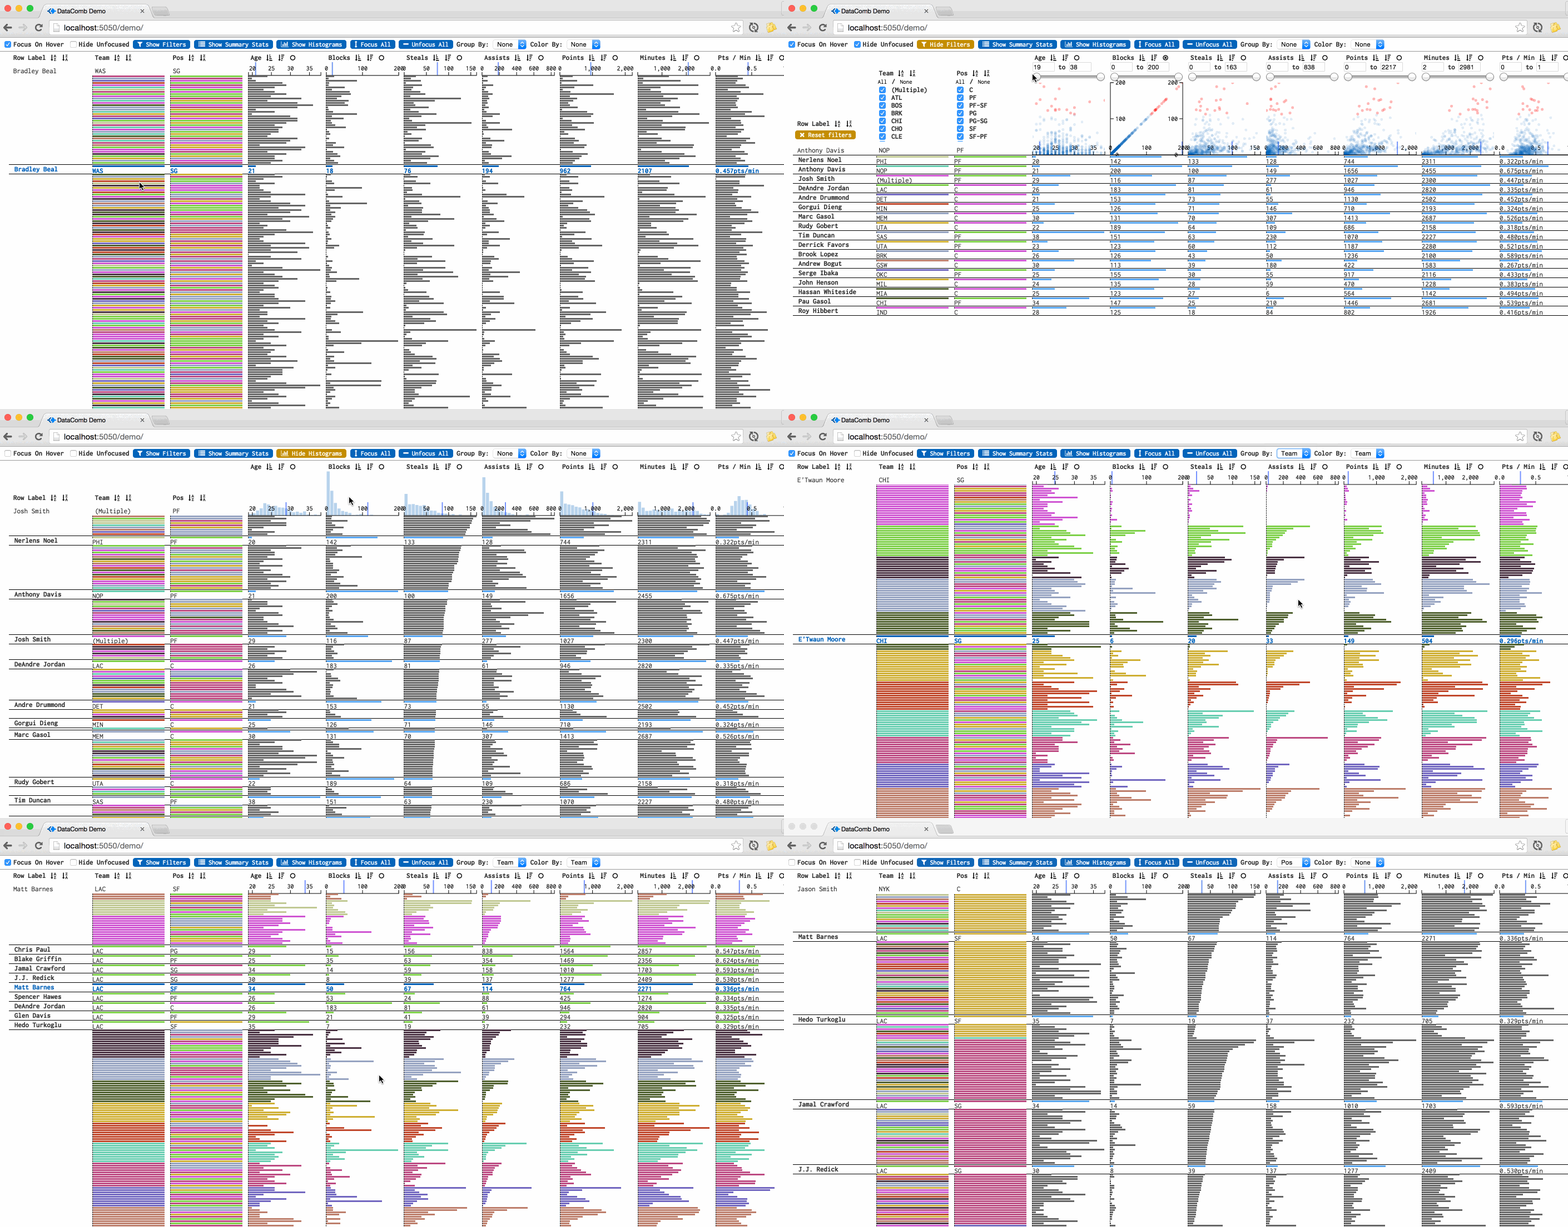
Turn your data into: live demo
Usage
As an htmlwidget in R
devtools::install_github('cmpolis/datacomb', subdir='pkg', ref='1.1.2');
library(datacomb);
Datacomb(iris)
In a browser, with JavaScript:
to build: $ npm install && npm run build
//
//
// Sample usage of Datacomb (see also: /demo/demo.js)

// Column definitions, meta data
var columns = [
  {
    label: 'Team',
    accessor: 'team',

    // columns that are not quantitative need `type` flag
    type: 'discrete'
  },
  {
   label: 'Pos',
   accessor: 'pos',
   type: 'discrete',
   sortOrder: 'PG SG SF PF C'.split(' ')
  },
  {
    label: 'Points',
    accessor: 'pts'
  },
  {
    label: 'Minutes',
    accessor: 'mp'
  },
  {
    label: 'Pts / Min',

    // column defenitions can be functions
    accessor: function(d) { return d.pts / d.mp },

    // can define `format` function to change how text is displayed on the tbale
    format: function(val) { return val.toFixed(3) + 'pts/min'; },
  }
];

// init the interface
var myDatacomb = new Datacomb({

  //
  el: document.getElementById('datacomb-target'),

  // array of objects
  data: [ {name: 'Hank', team: 'Liverpool', points: 3 }, { ... }, ... ],

  //
  columns: columns,

  //
  labelAccessor: 'name'

});
Catalog of Interactions
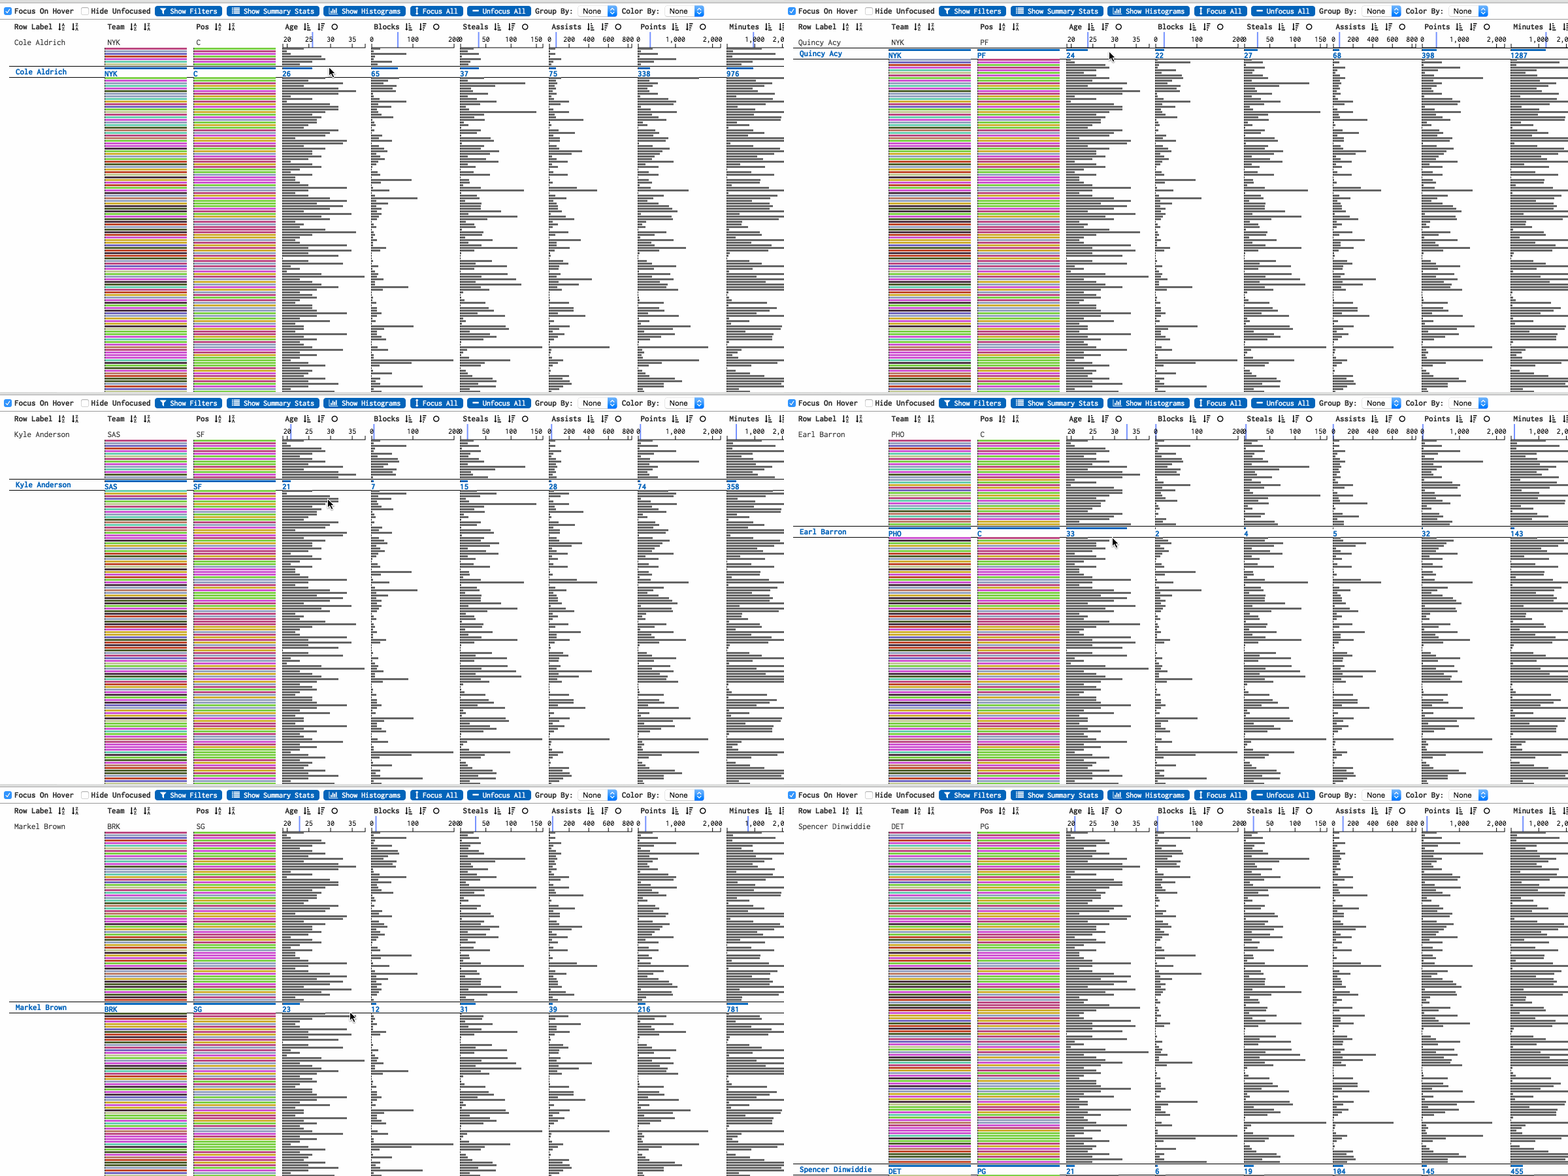
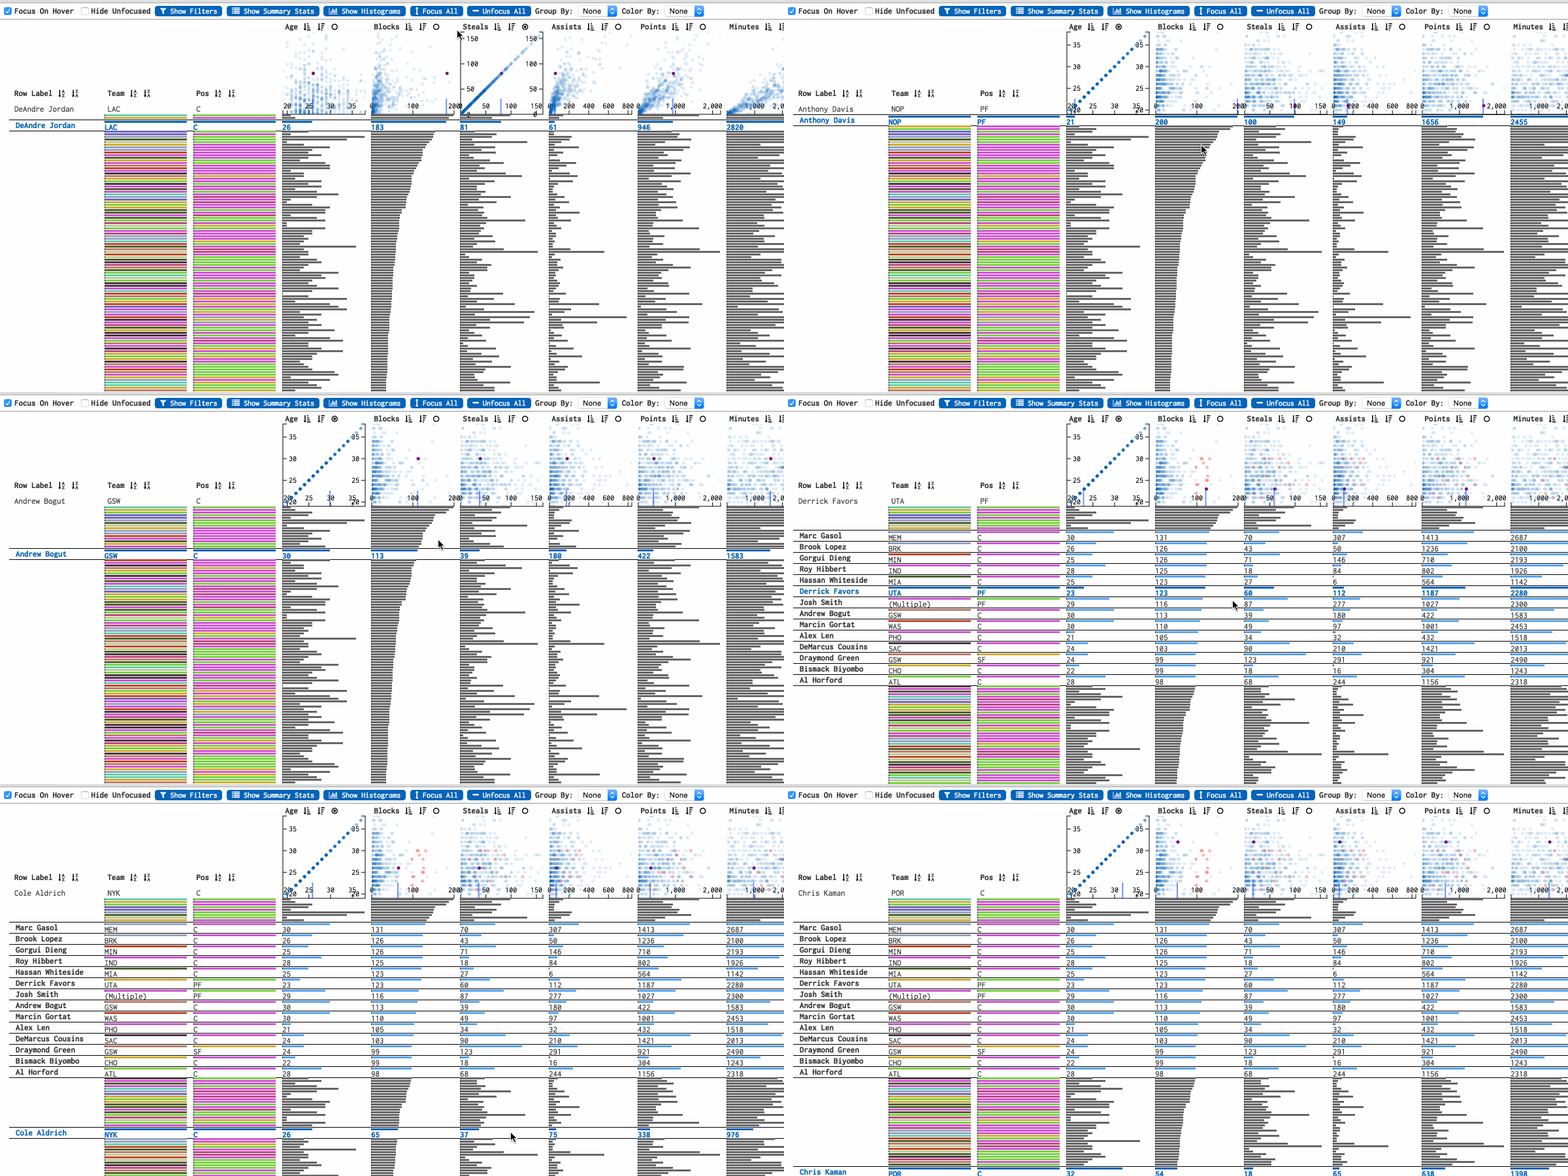
Hover over rows to reveal exact values
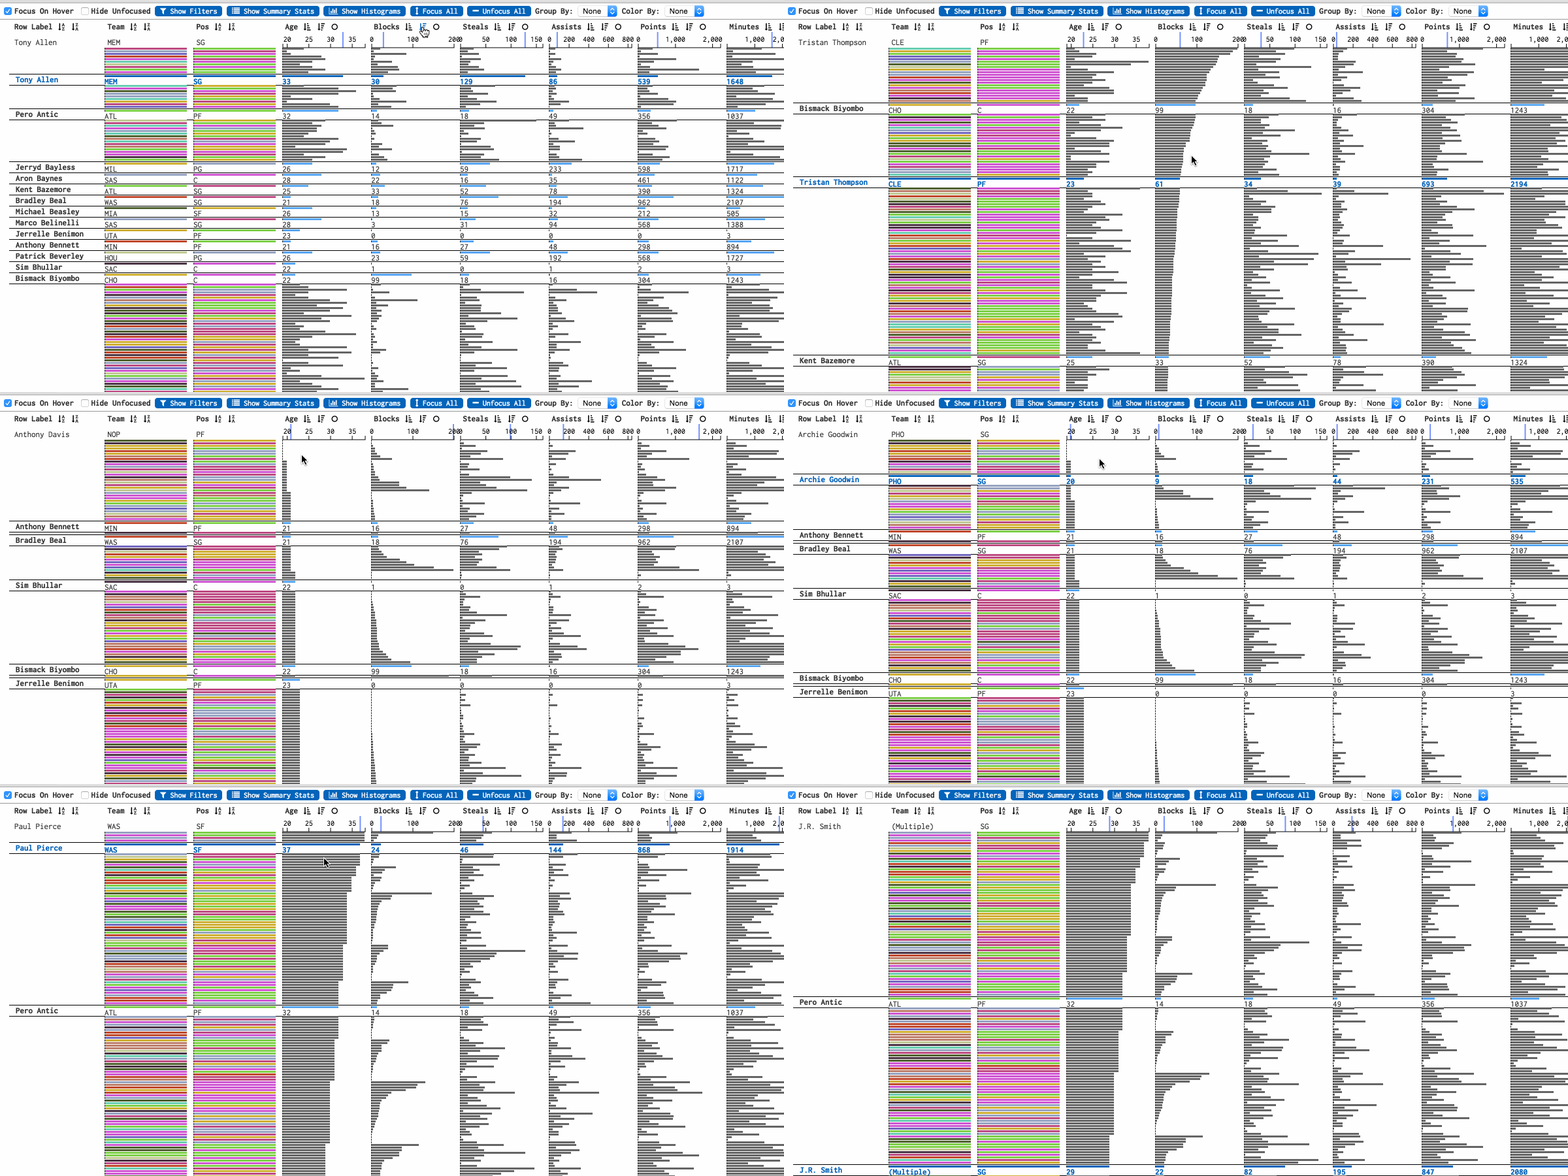
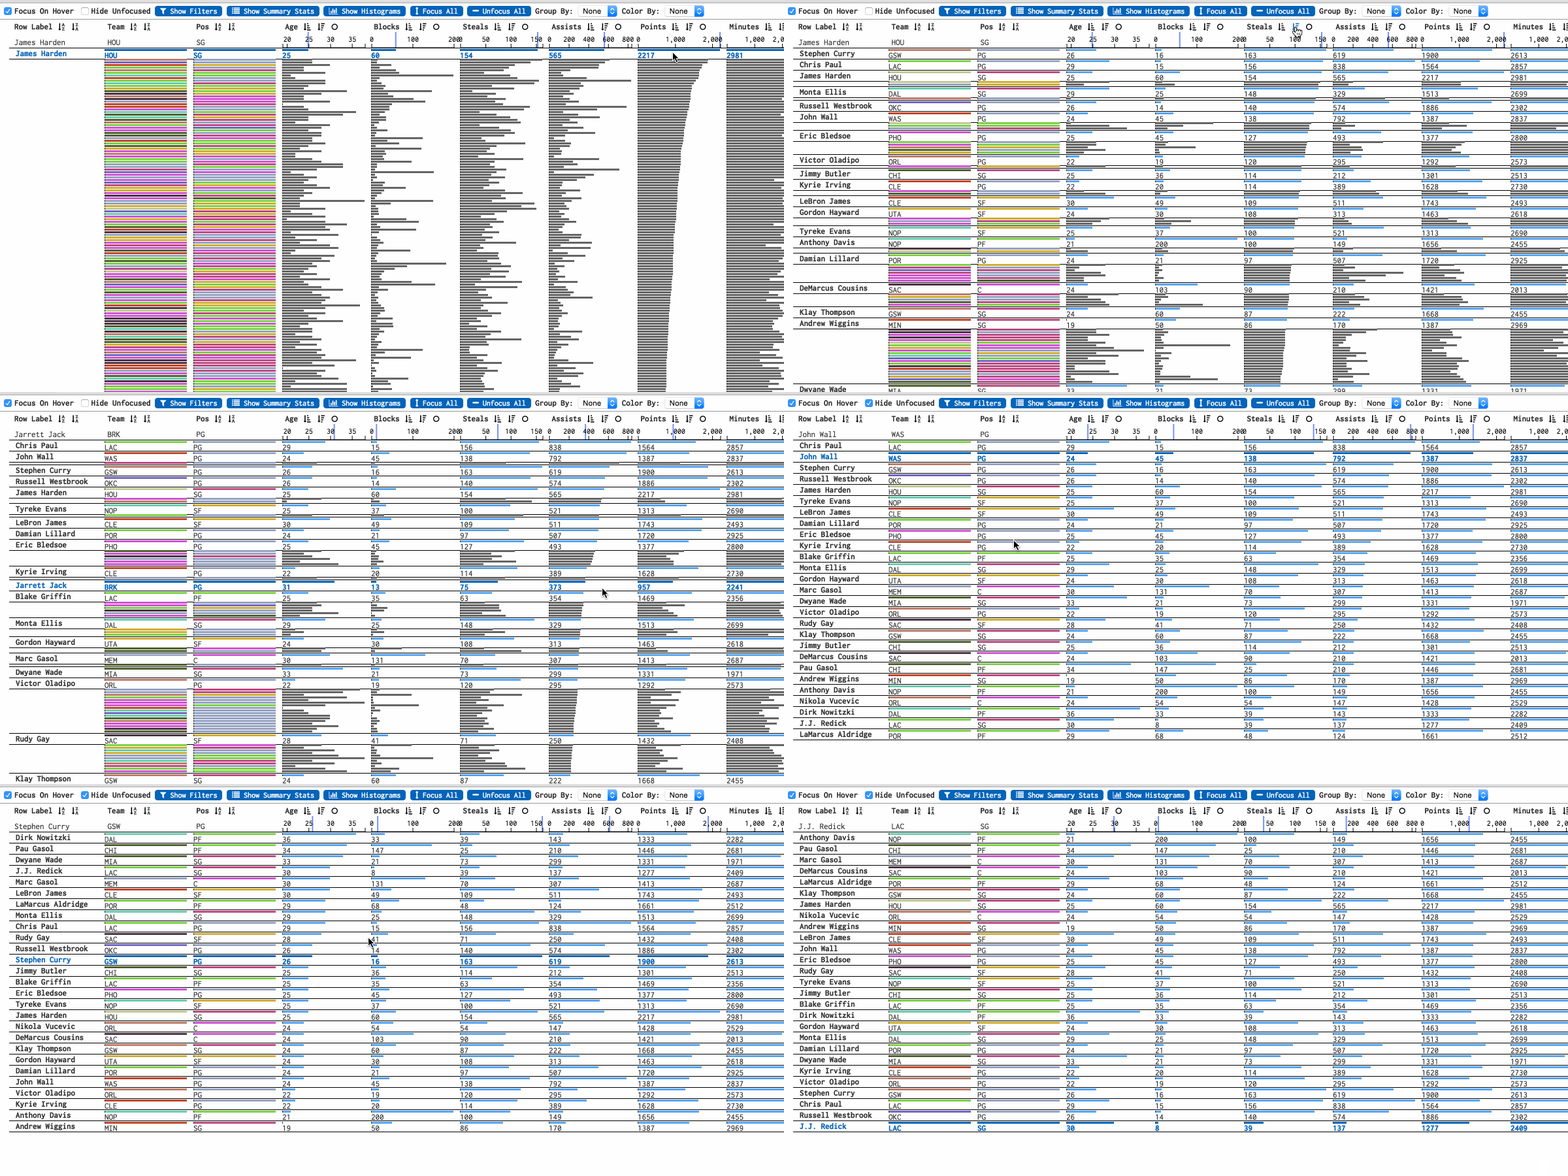
Sort by column(s)
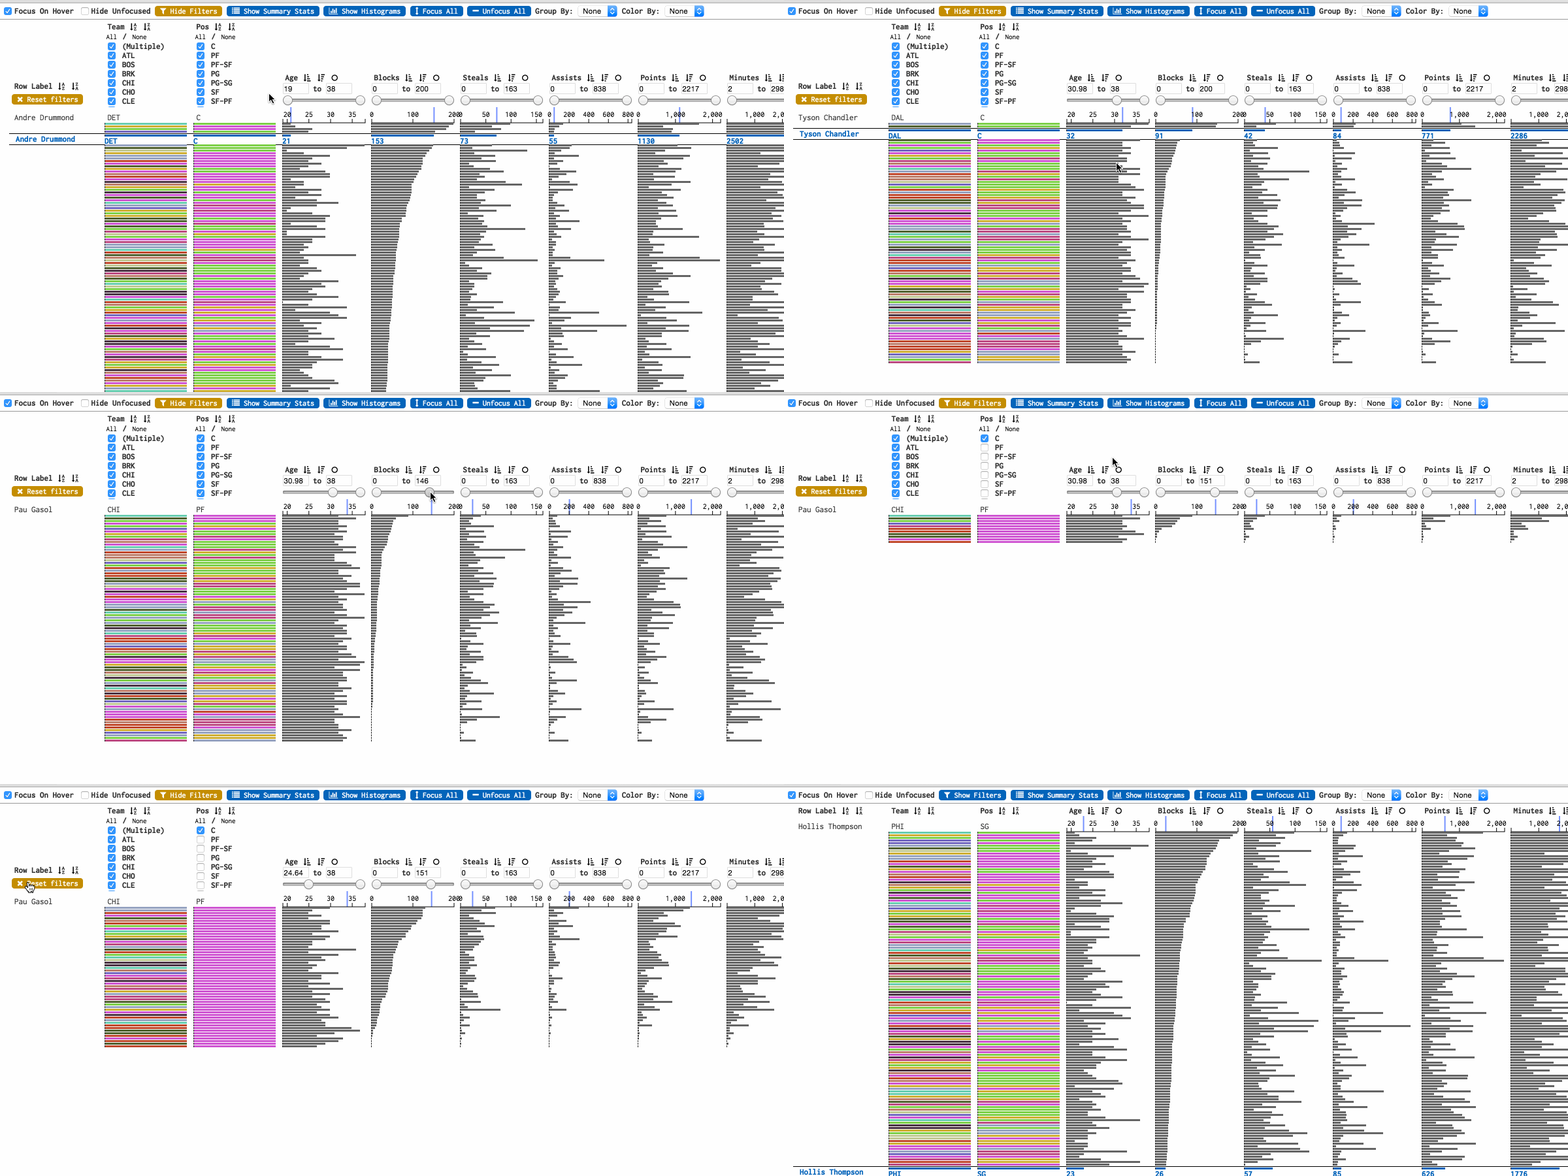
Filter rows visually with a slider or by specifiying exact bounds
Click and drag to select rows to focus
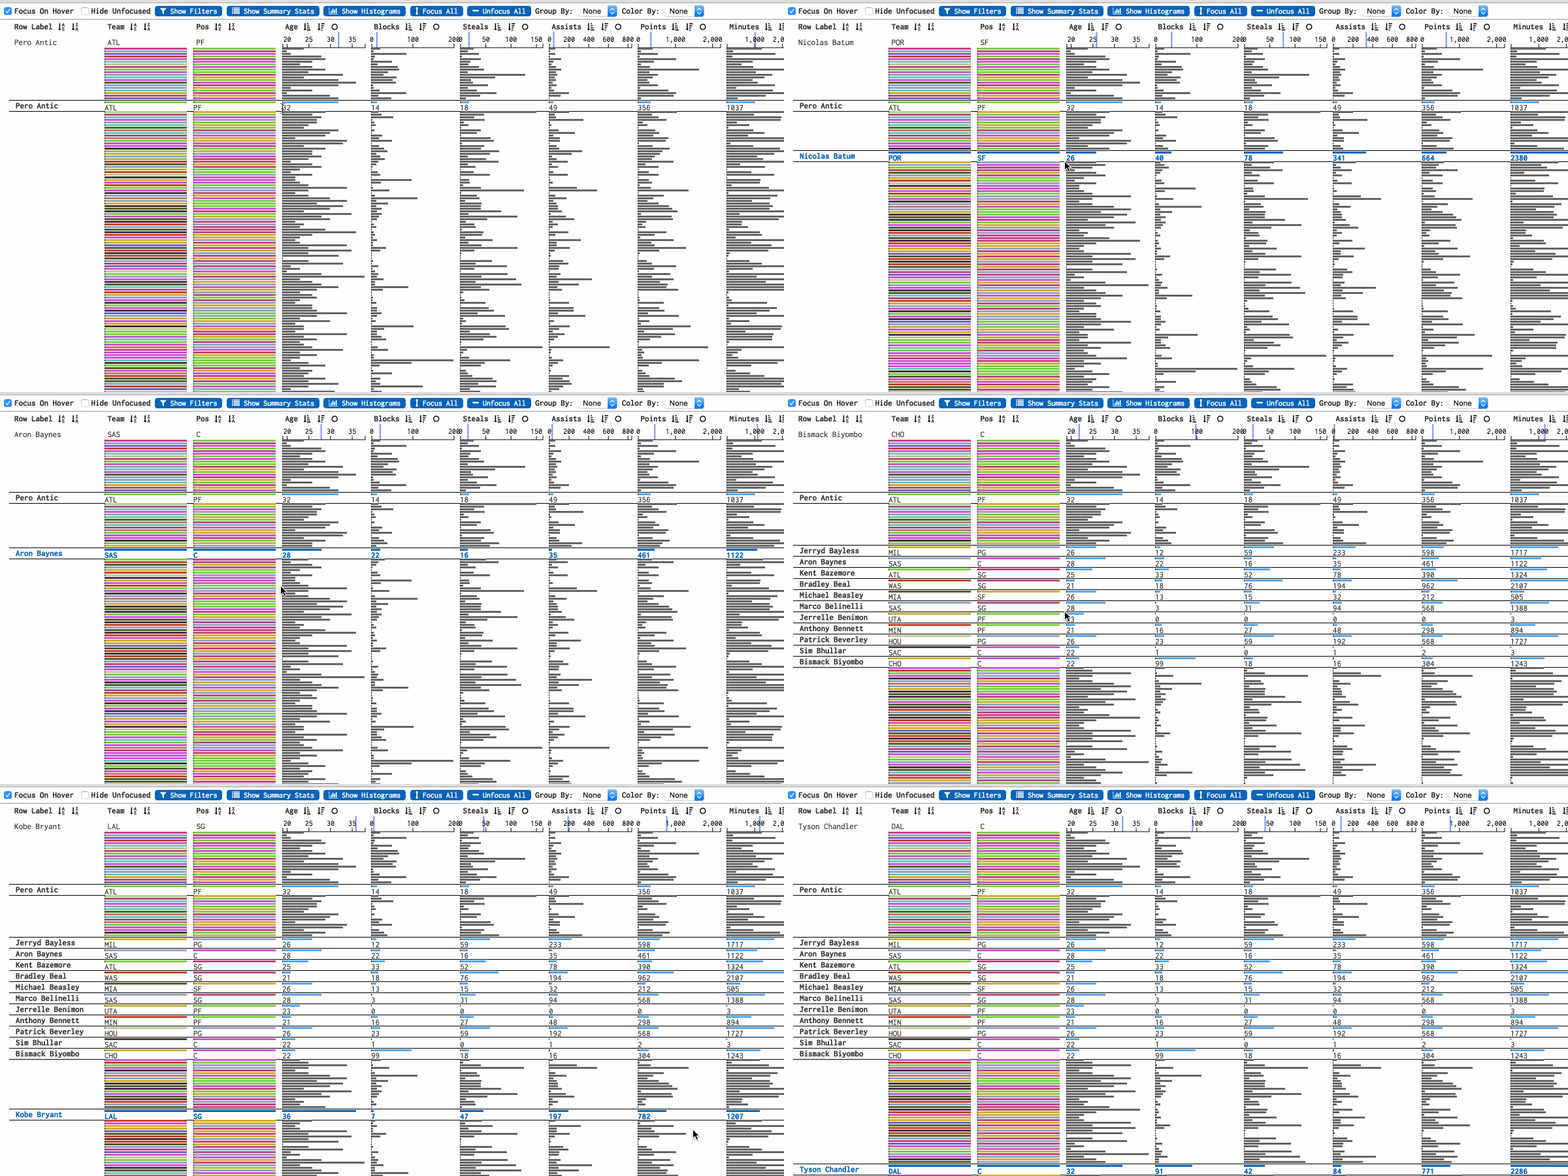
Show only selected rows to analyze a subset
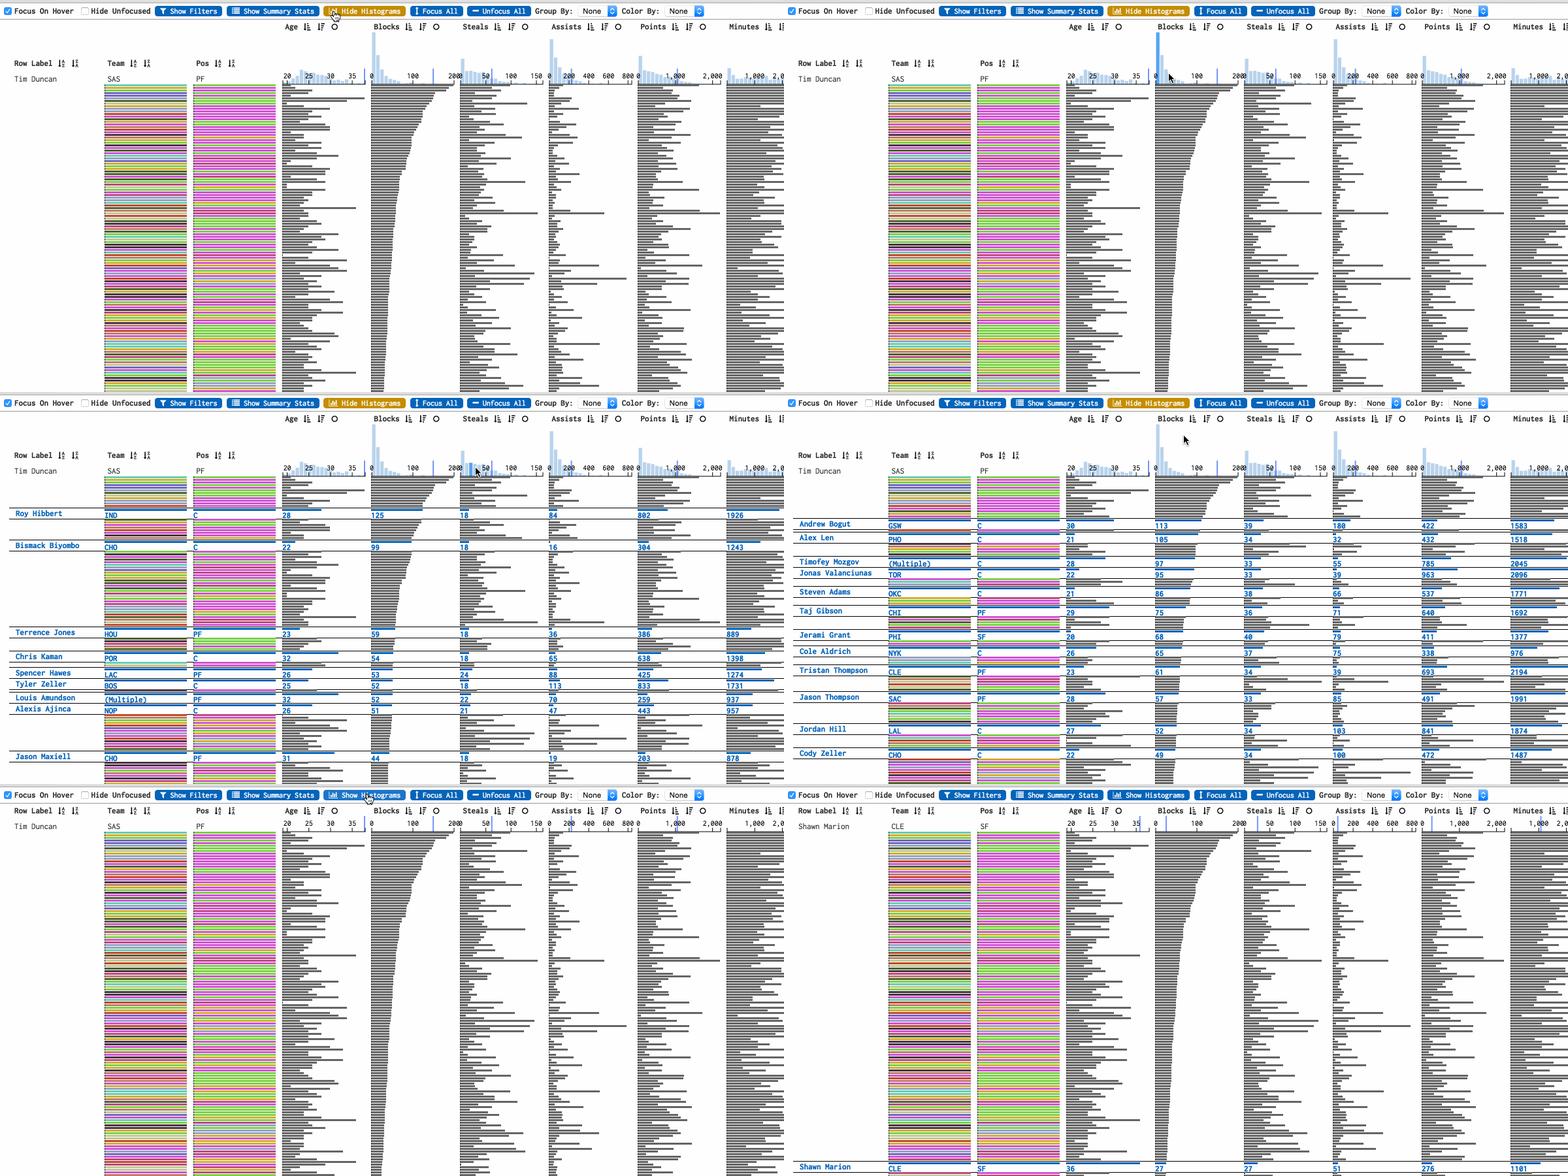
View distribution data for each column
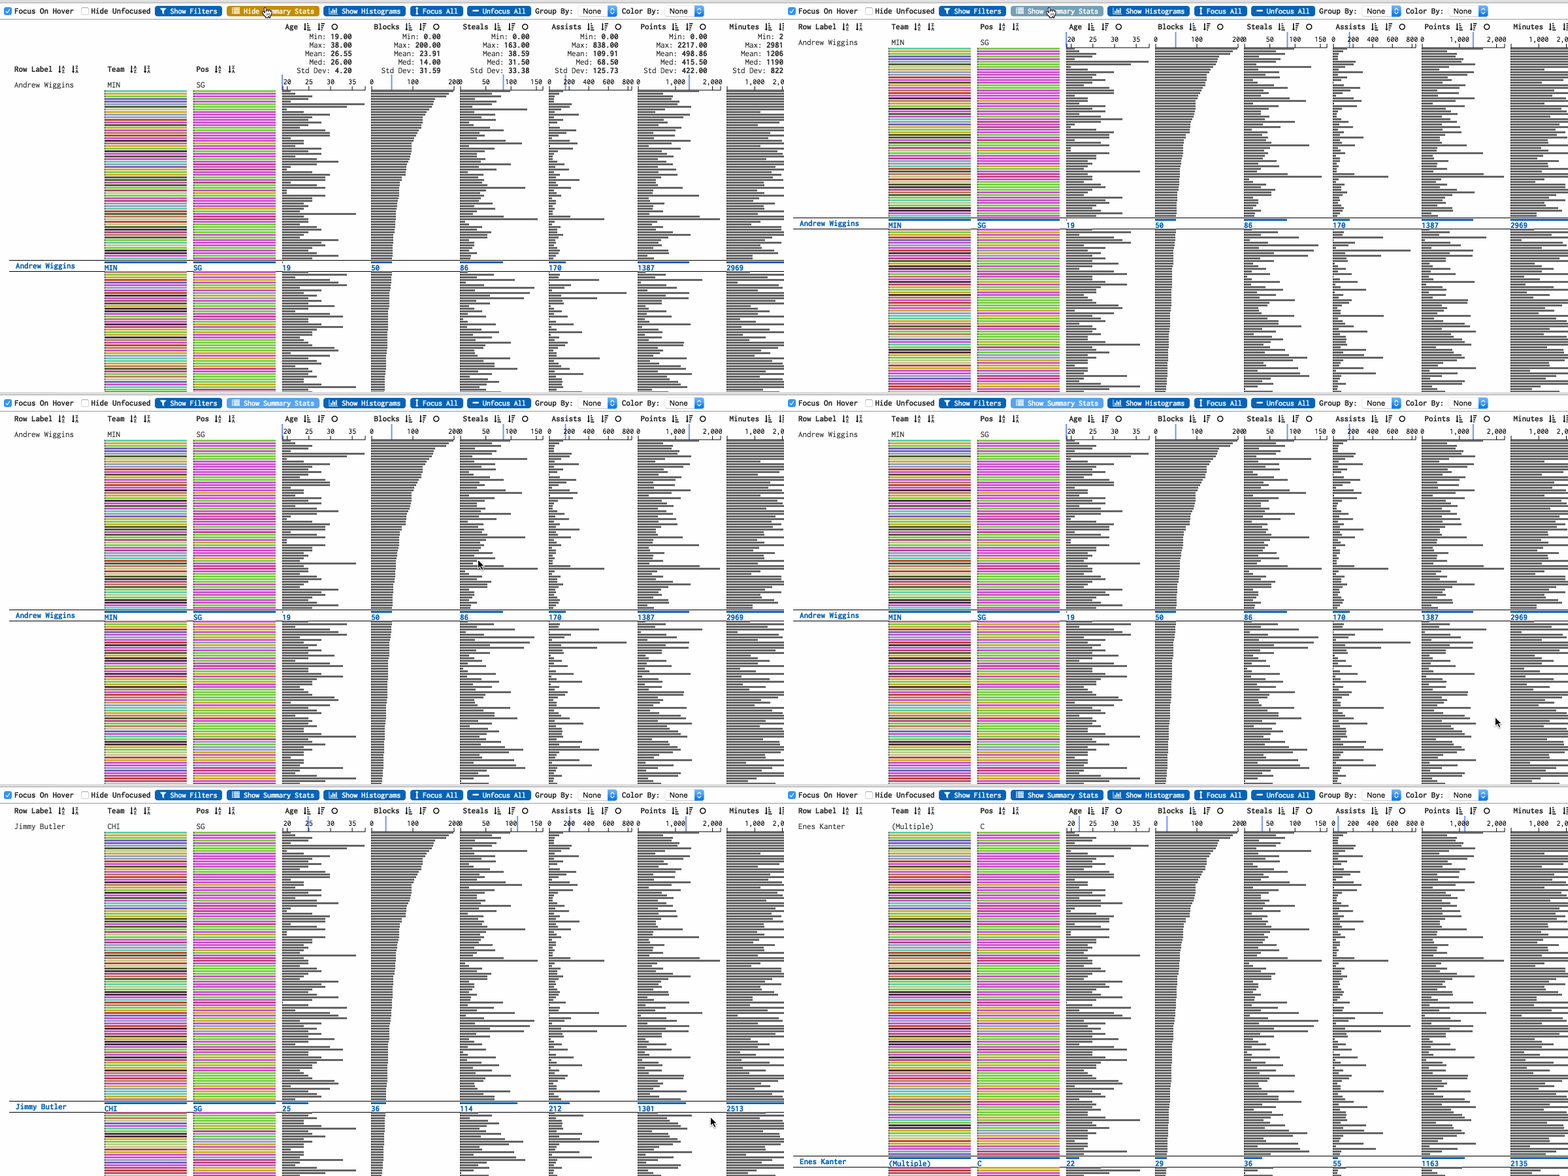
View summary statistics for each column
View relationships between columns by creating scatter plots of a column and all other columns
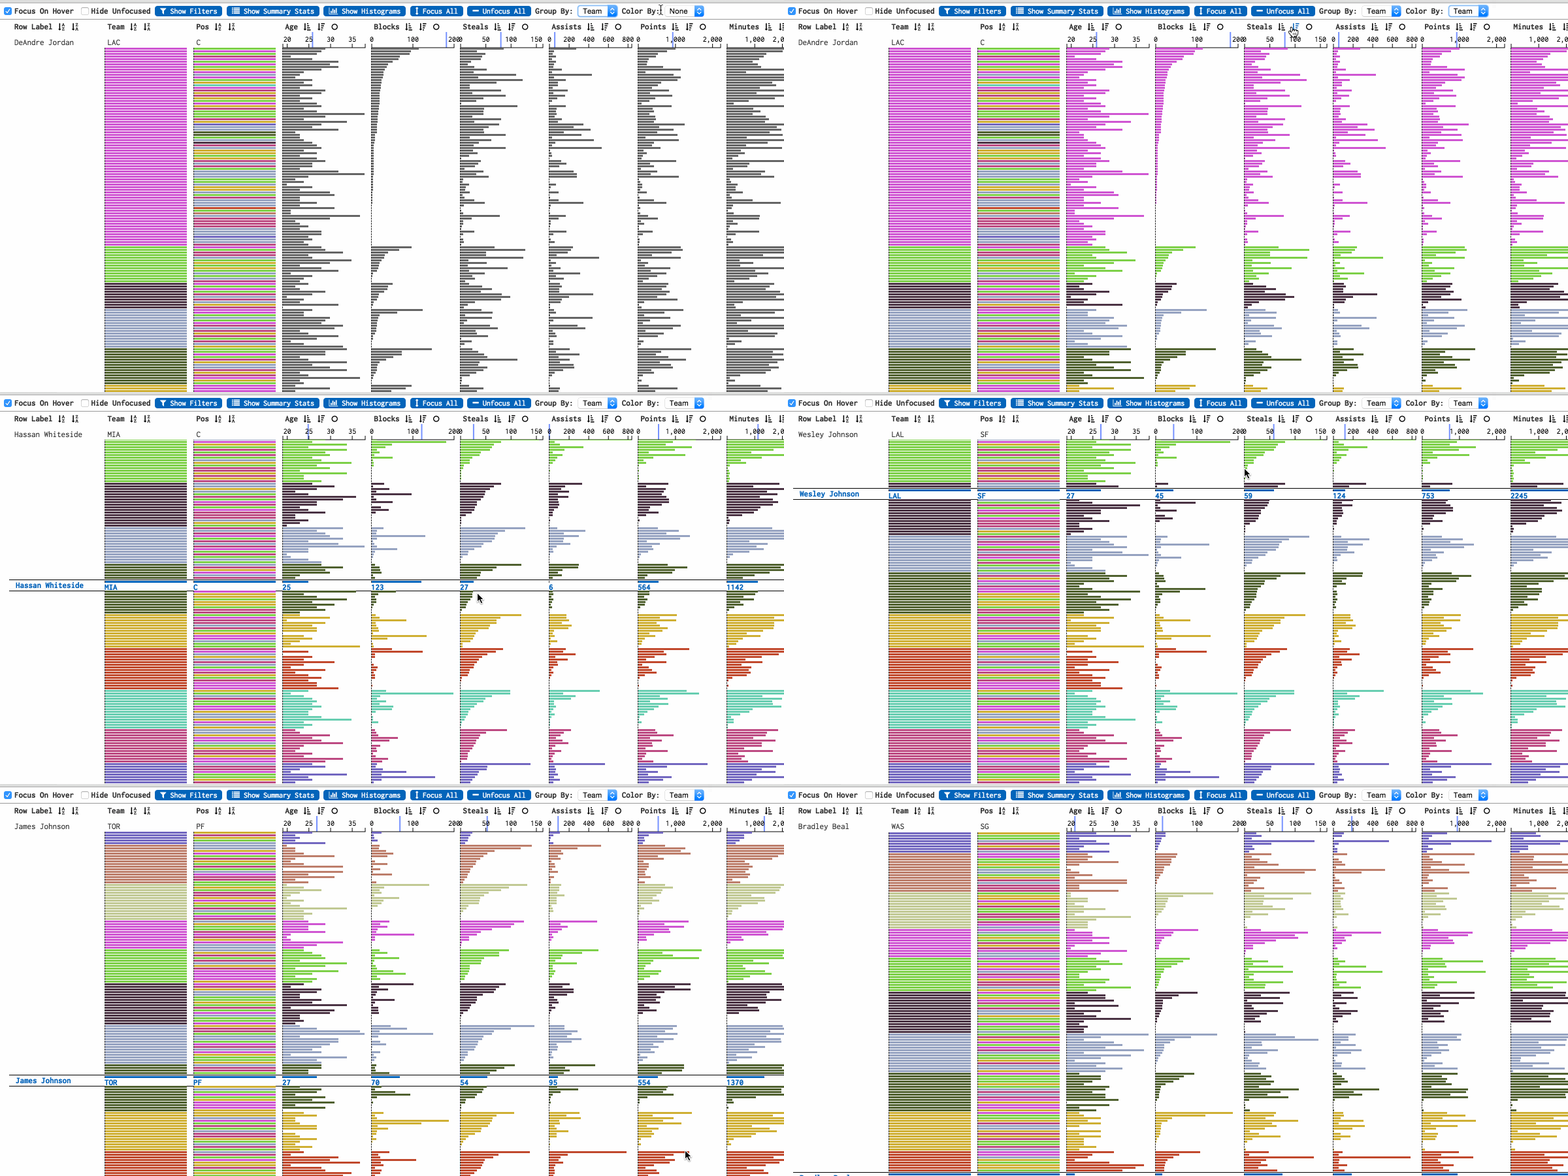
Group rows by discrete dimensions
Contributing
Pull requests welcomed! However, please try to mention or ask about it as an issue to make sure what you are working on will be merged in and is not already in progress.
$ npm install
$ npm run build
$ npm run serve
$ open http://localhost:5050/demo/
Testing
$ npm test
Resources
Blog post, demo of prototype/old version: http://www.bytemuse.com/post/data-comb-visualization/
R Package(CRAN!): https://github.com/mtennekes/tabplot
Table Lens Paper: https://www.cs.ubc.ca/~tmm/courses/cpsc533c-04-fall/readings/tablelens.pdf
Demo dataset sources:
- diamonds: https://vincentarelbundock.github.io/Rdatasets/datasets.html
- nba players: http://www.basketball-reference.com/
Status, project todo, notes
- [IN PROGRESS] v1/prototype:
- :thumbsup: project setup: can build, test, view in browser...
- :thumbsup: (https://github.com/cmpolis/smart-table-scroll) table row reuse (minimize # of <.row> DOM elements)
- :thumbsup: table layout and properly sized bars
- :thumbsup: hover interaction
- :thumbsup: click interaction
- :thumbsup: drag interaction
- :thumbsup: filtering
- :thumbsup: sorting
- :thumbsup: scatter plots (canvas)
- :thumbsup: histograms
- :thumbsup: summary statistics
- :thumbsup: grouping (by discrete dimensions)
- :thumbsup: coloring (by discrete dimensions)
- v2
- :x: expandable(full screen?) scatter plots
- :x: regressions in scatter plots
- :x: dynamic column addition, removal
- :x: custom column widths
- :x: functional column definitions from ui: eg:
areaCol: ${height} * ${width} - :x: axis labels
- :x: log scaling
- :x: quantize columns (continuous dim -> discrete dim)
- :x: illustrate filter response on histograms
- :x: illustrate filter response on scatter plots
- :x: close/expand groupings in table
- :construction: keyboard shortcuts
- :construction: HTMLWidget/R package
- :x: Serializable table configuration format. JSON?
- :x: Natural language/DSL mode for table configuration, querying
Released under the MIT License.
Core symbols most depended-on inside this repo
isArraycalled by 87
pkg/inst/htmlwidgets/lib/datacomb.js
isObject
called by 40
pkg/inst/htmlwidgets/lib/datacomb.js
getKeypath
called by 39
pkg/inst/htmlwidgets/lib/datacomb.js
isIterateeCall
called by 34
pkg/inst/htmlwidgets/lib/datacomb.js
d3_functor
called by 30
pkg/inst/htmlwidgets/lib/datacomb.js
isNaN
called by 29
pkg/inst/htmlwidgets/lib/datacomb.js
restParam
called by 27
pkg/inst/htmlwidgets/lib/datacomb.js
getCallback
called by 25
pkg/inst/htmlwidgets/lib/datacomb.js
Shape
Languages
TypeScript100%
Modules by API surface
pkg/inst/htmlwidgets/lib/datacomb.js1,386 symbols
src/js/datacomb.js1 symbols
pkg/inst/htmlwidgets/lib/index.js1 symbols
For agents
$ claude mcp add datacomb \
  -- python -m otcore.mcp_server <graph>