github.com/certinia/debug-log-analyzer @1.20.0
Chat with this repoWhat it actually does AI analysis from the code graph — generated when you open this
README
🚀 Apex Log Analyzer – Visualize Salesforce Debug Logs in VS Code
Analyze Salesforce Apex Debug logs with blazing speed.
Apex Log Analyzer is a blazing-fast VS Code extension for Salesforce developers. Instantly visualize and debug Apex logs with interactive flame charts, dynamic call trees, and detailed SOQL/DML breakdowns. Identify performance bottlenecks, gain deep insight into complex transactions and optimize slow Apex methods faster than ever.
Installation | Debug Log Levels | Features | Customization | Documentation | Contributors | License
🚀 Key Features
- 🔥 Timeline – Visualize every method, SOQL query, and DML operation in your Apex logs with an interactive flame chart and minimap navigation.
- 🌲 Interactive Call Tree – Dive into execution stacks with timing, row counts, and DML/ SOQL metrics.
- 📊 Apex + Database Analysis – Identify slow-performing SOQL, high-impact DML, and time-heavy Apex methods.
- 📄 Raw Log Navigation – Jump between analysis views and raw log files with code folding, hover details, and bidirectional navigation.
- 🧠 Smart Filtering + Sorting – Focus on what matters: filter by namespace, event type, or duration.
- 🔍 Deep Search – Find events across the flame chart, call tree, and database tables.
- 📤 Export + Share – Copy or Export Salesforce debug log insights for analysis or collaboration.
✨ Works with any
.logSalesforce debug log file.🧪 Pre-Release only — available in the Pre-Release Version; not yet in the stable release.
🛠️ Installation
📦 Install Apex Log Analyzer in VS Code
You can install Apex Log Analyzer directly from Visual Studio Code, the command line, or the Visual Studio Code Marketplace.
✅ Option 1: Install via VS Code
- Open the Extensions sidebar (
Ctrl+Shift+XorCmd+Shift+X). - Search for
Apex Log Analyzer. - Click Install.
🌐 Option 2: Install from Marketplace
➡️ Install Apex Log Analyzer on Visual Studio Code Marketplace
>_ Option 3: Install via Command Line
code install financialforce.lana
✨ Try the Pre-Release Version
💡 Access experimental features and shape future updates by switching to the Pre-Release Version from the extension banner in VS Code.
⚡ How It Works
Start Analysis
You can analyze logs in two ways:
1. Analyze an Open Log File
- Open a
.logfile in VS Code. - Run
Log: Show Apex Log Analysisvia: - Command Palette (
Ctrl/Cmd + Shift + P) - Top-of-file code lens
- Right-click menu
- Editor toolbar button
2. Download a Log from Your Org
Use Log: Retrieve Apex Log And Show Analysis from the Command Palette.
⚙️ Recommended Debug Log Levels
- Set
APEX_CODElevel toFINEor higher — lower levels may omit important execution details. - Be aware that higher debug levels introduce logging overhead, which can inflate recorded execution times.
- Avoid truncated logs — they can result in incomplete or misleading analysis.
- Recommended settings for a good balance of detail and performance:
APEX_CODE,FINE; APEX_PROFILING,FINE; CALLOUT,INFO; DB,FINEST; NBA,INFO; SYSTEM,DEBUG; VALIDATION,INFO; VISUALFORCE,FINE; WAVE,INFO; WORKFLOW,FINE
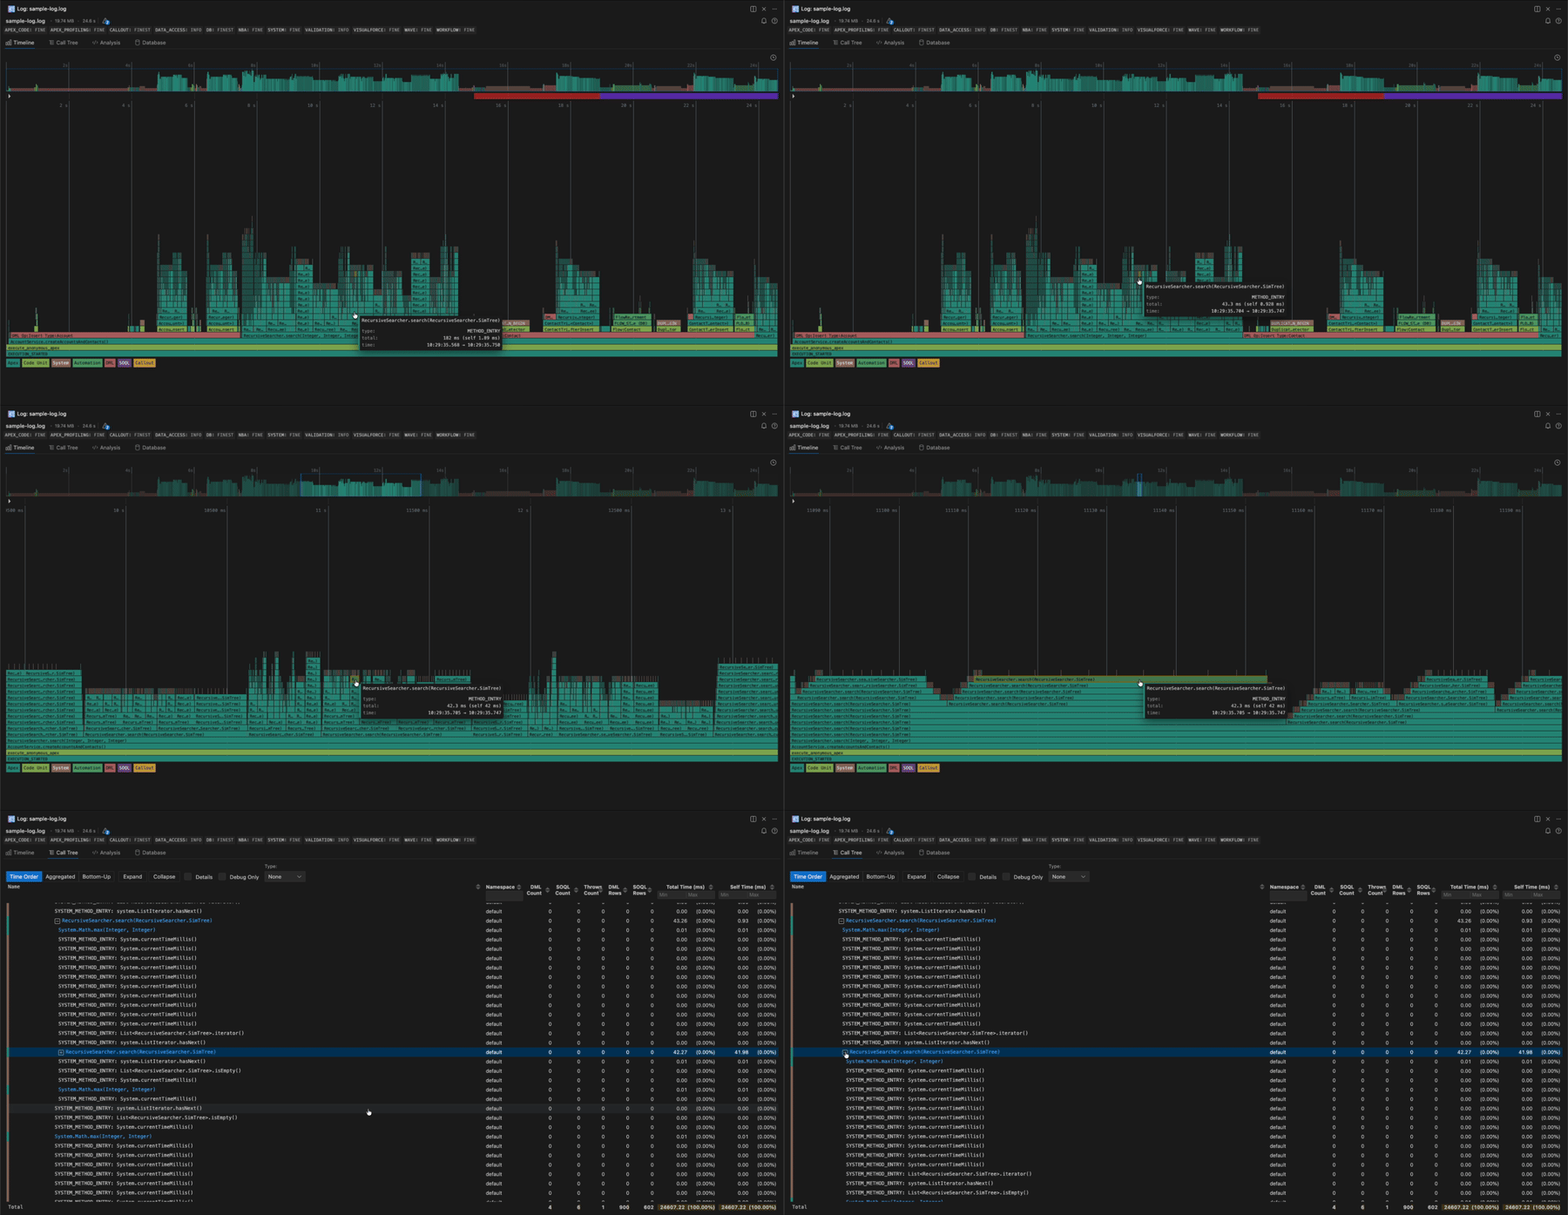
🔥 Timeline
The Timeline view shows a live visualization of your Salesforce Apex log execution — including methods, SOQL queries, DML operations, workflows, flows, and more.
- ⚡ Fast – Blazing-fast zoom, pan, and rendering even on massive logs (500k+ lines).
- 🗺️ Minimap – Bird's-eye view with skyline density overview, viewport lens, and instant teleport.
- 📊 Governor Limits Strip – At-a-glance limit usage with traffic light coloring. Expand for detailed step chart.
- 📏 Measure & Zoom –
Shift+Dragto measure durations,Alt/Option+Dragto area-zoom, precision keyboard controls. - 🕐 Wall-Clock Time – Toggle between elapsed and real-time (HH:MM:SS.mmm) on the time axis via the toolbar clock button.
Also: Frame Selection & Navigation, Dynamic Frame Labels, Adaptive Frame Detail, Tooltips, Context Menu, Search & Highlight, 19 Curated Themes.
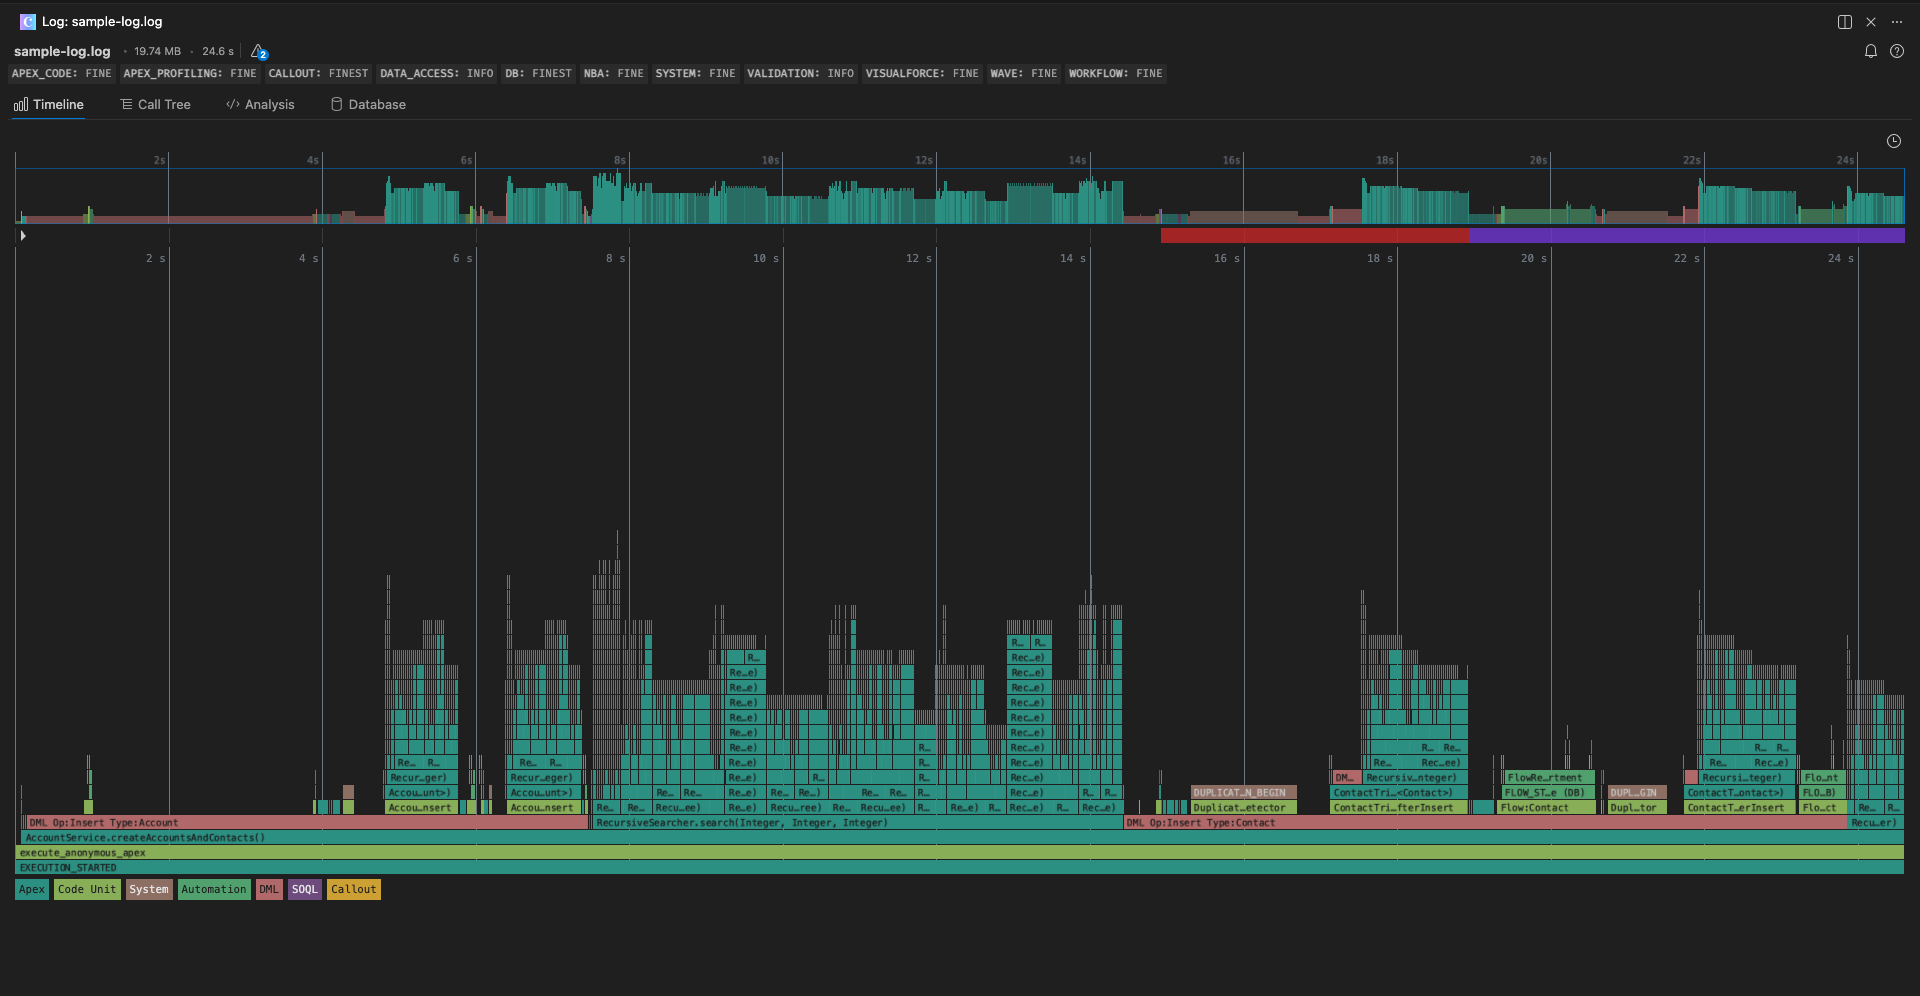
🧠 Great for spotting long-running operations, inefficient queries, and bottlenecks.
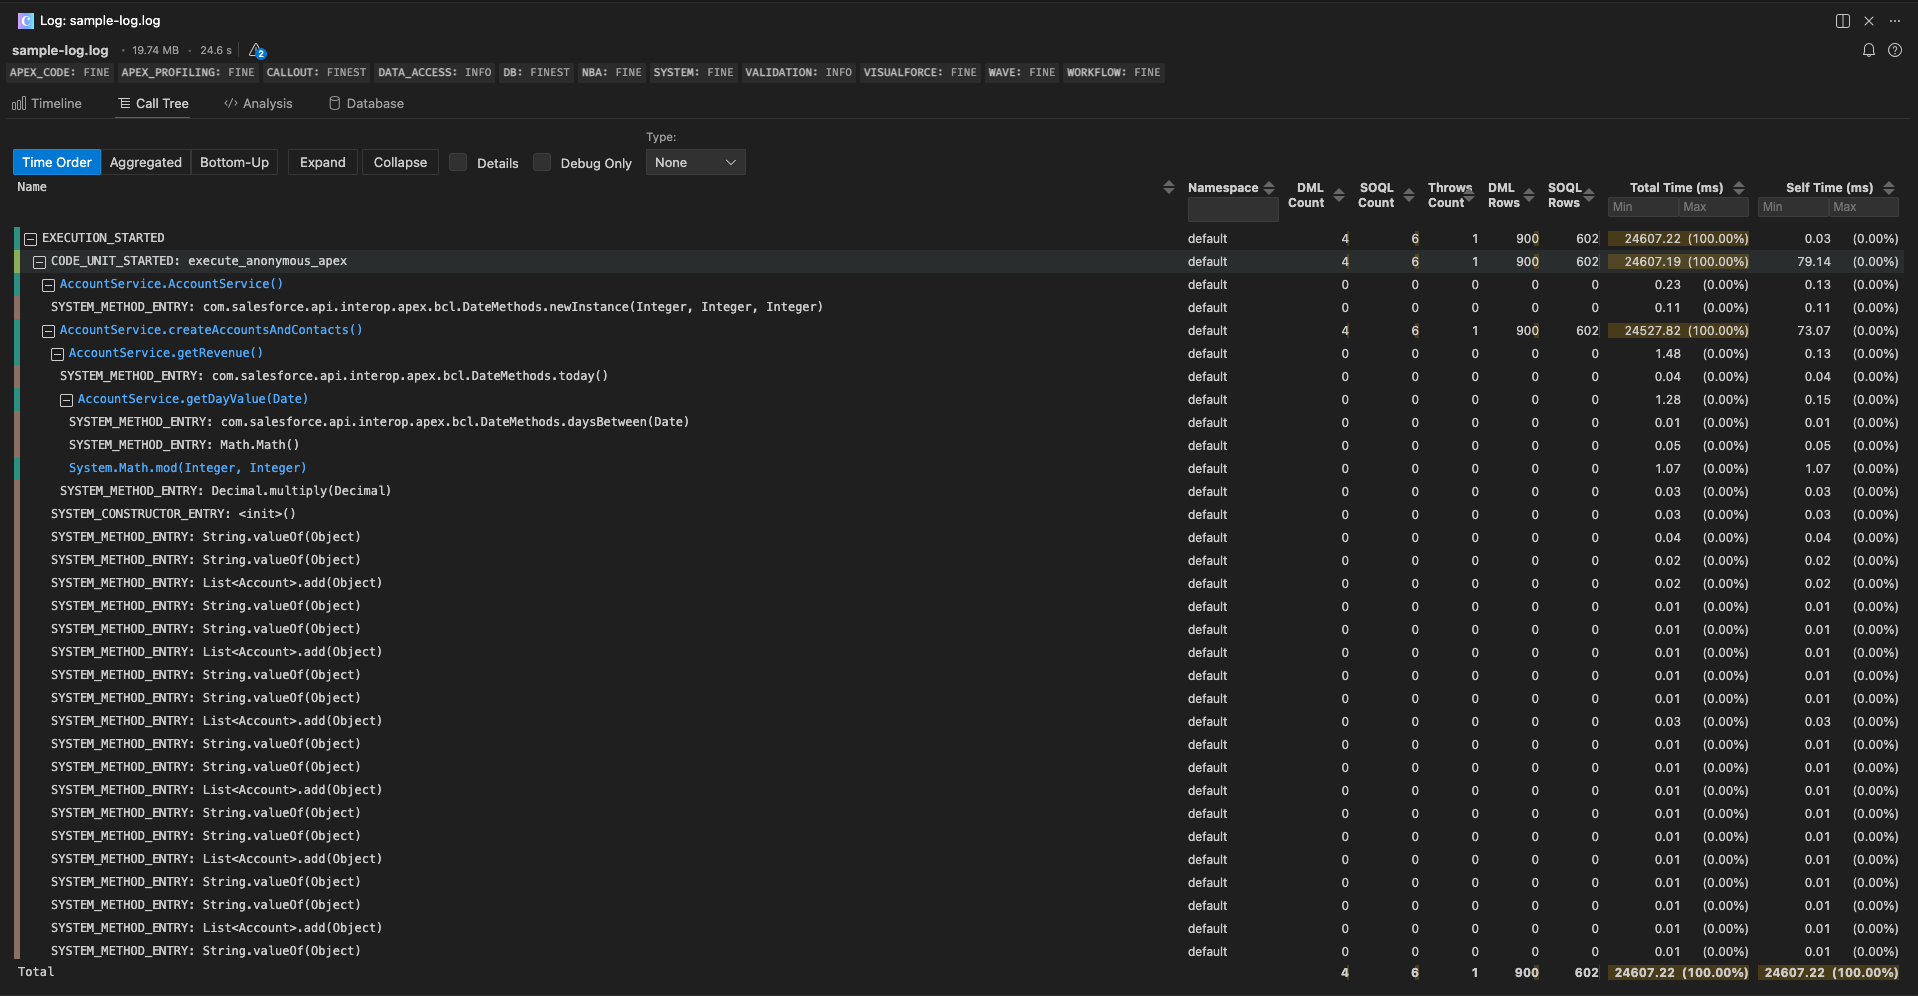
🌲 Call Tree
Explore nested method calls with performance metrics:
- Metrics: Self Time, Total Time, SOQL/DML/Thrown Counts, SOQL/DML/Rows
- Views: Use Time Order for sequence, Aggregated for repeated hot paths, Bottom-Up for caller attribution
- Filter by Namespace, Type or Duration
- Toggle Debug-Only + Detail Events
- Keyboard Navigation
- Click to go to Code – Jump to the source method in your project
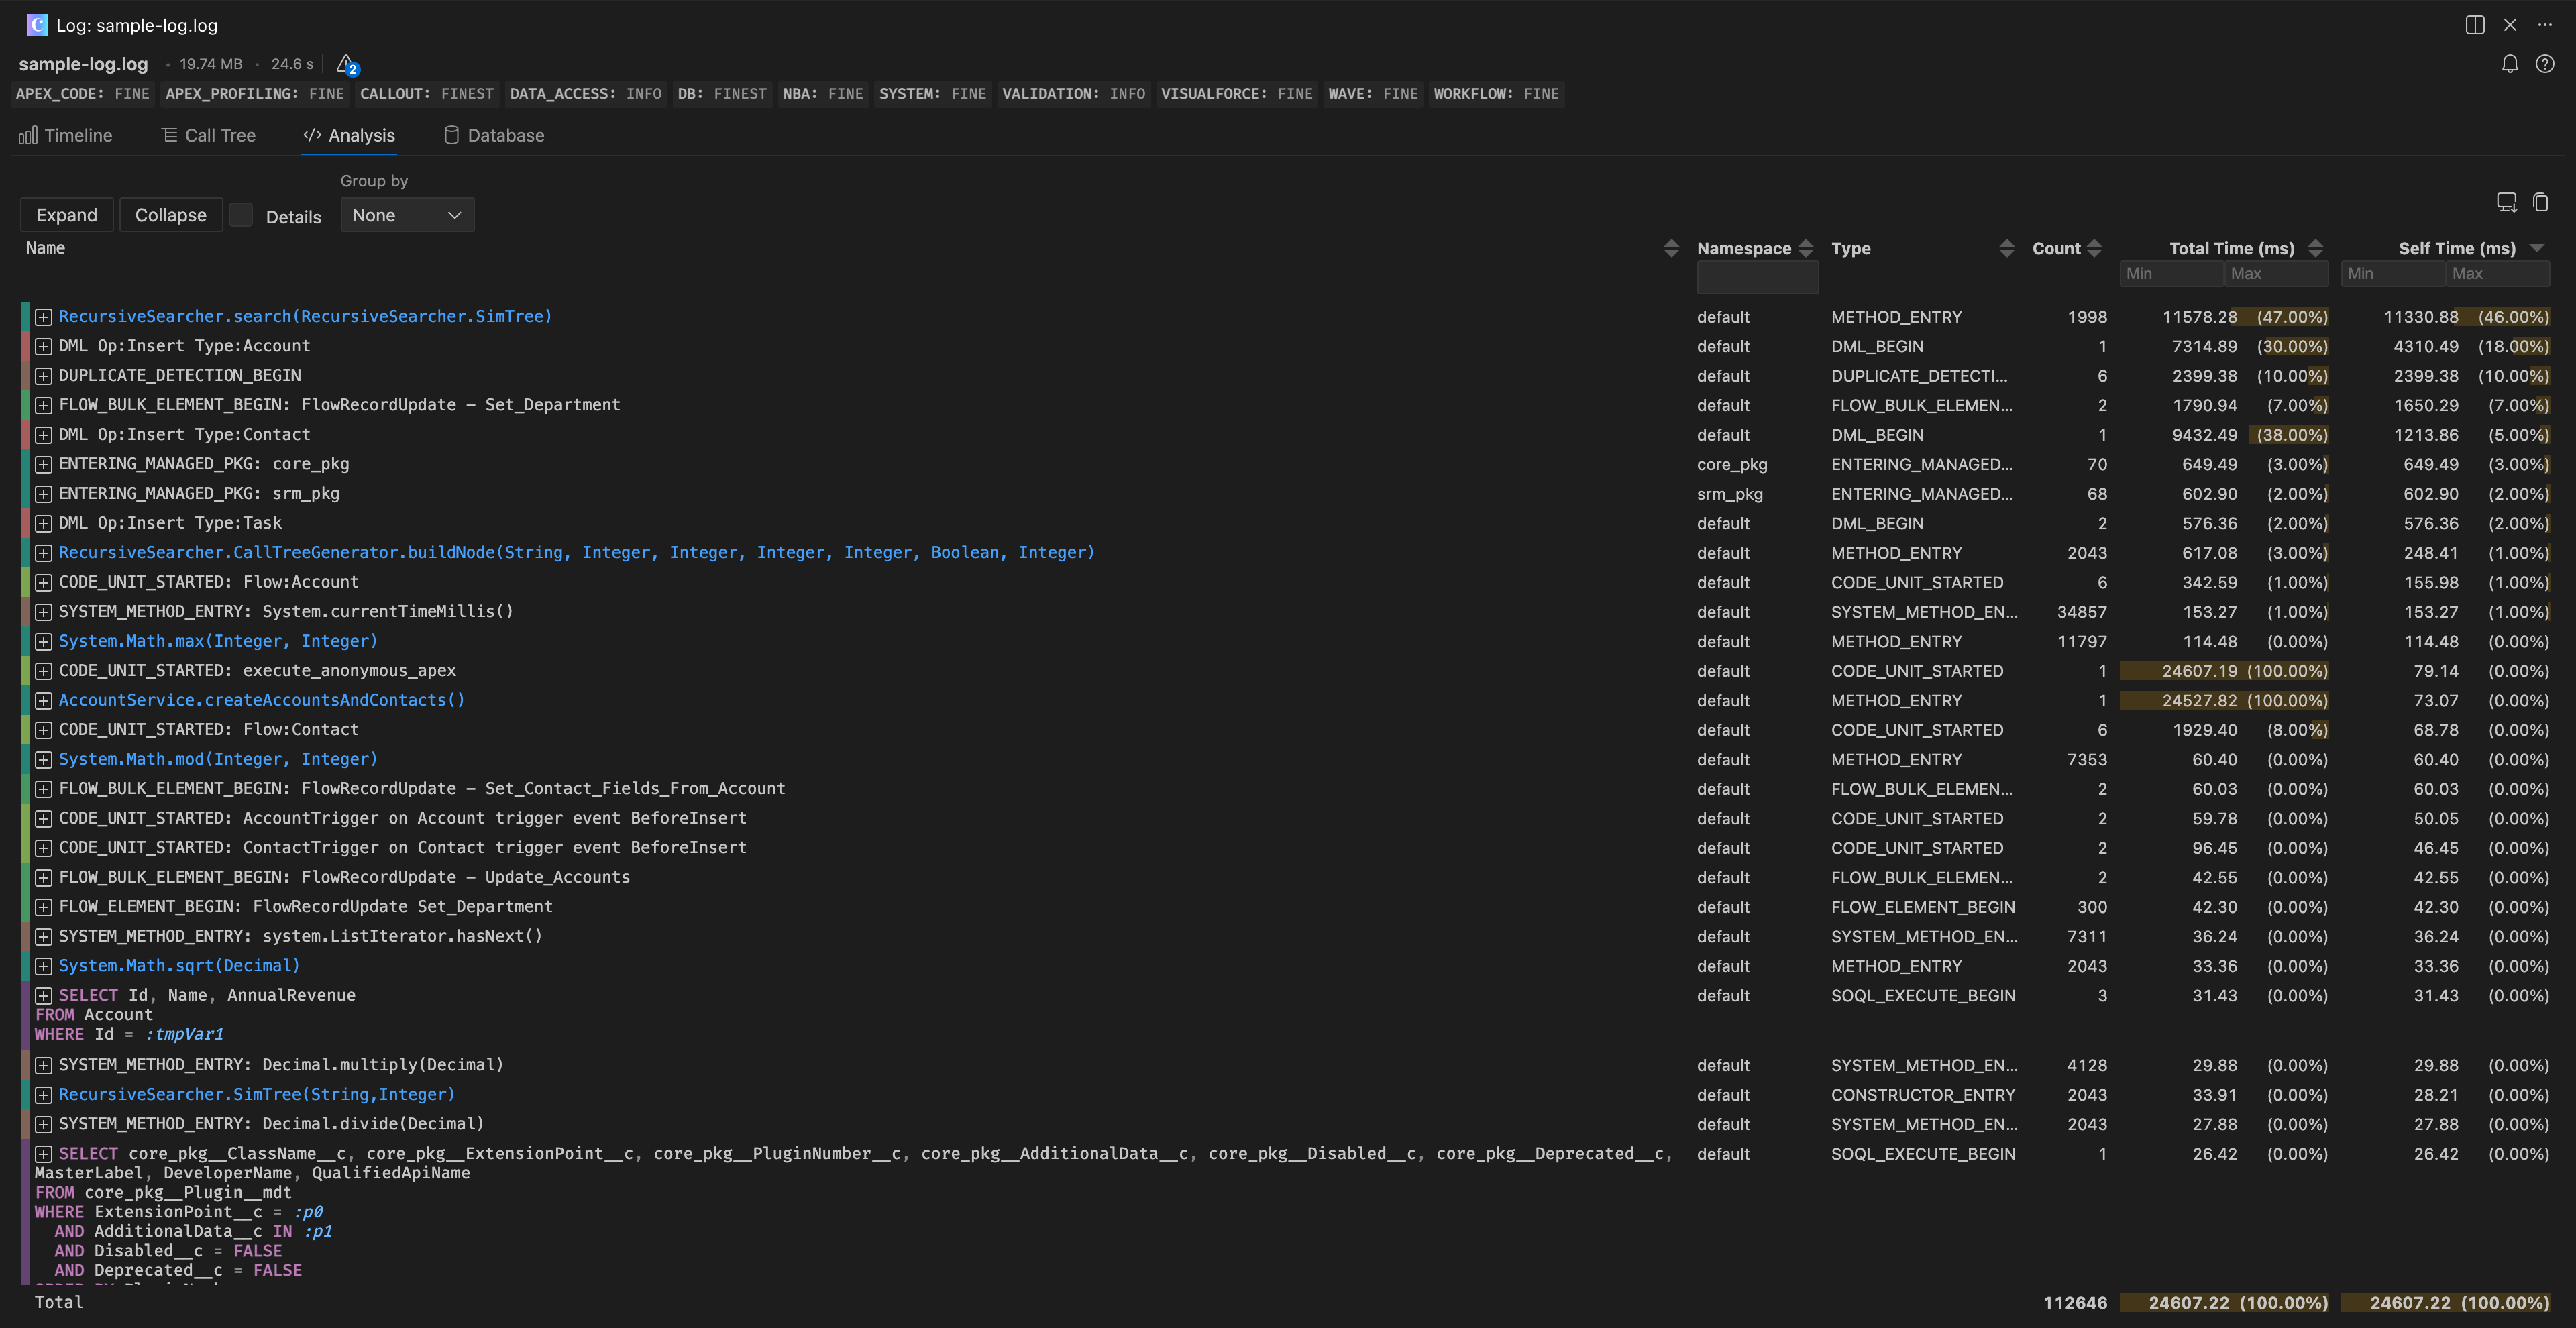
🧠 Apex Analysis
See which methods are the slowest, most frequent. or expensive.
- **Group by Type, Namespace, or Caller Namespace **
- Sort by Duration, Count, Name, Type or Namespace
- Filter to specific event types
- Copy or Export to CSV
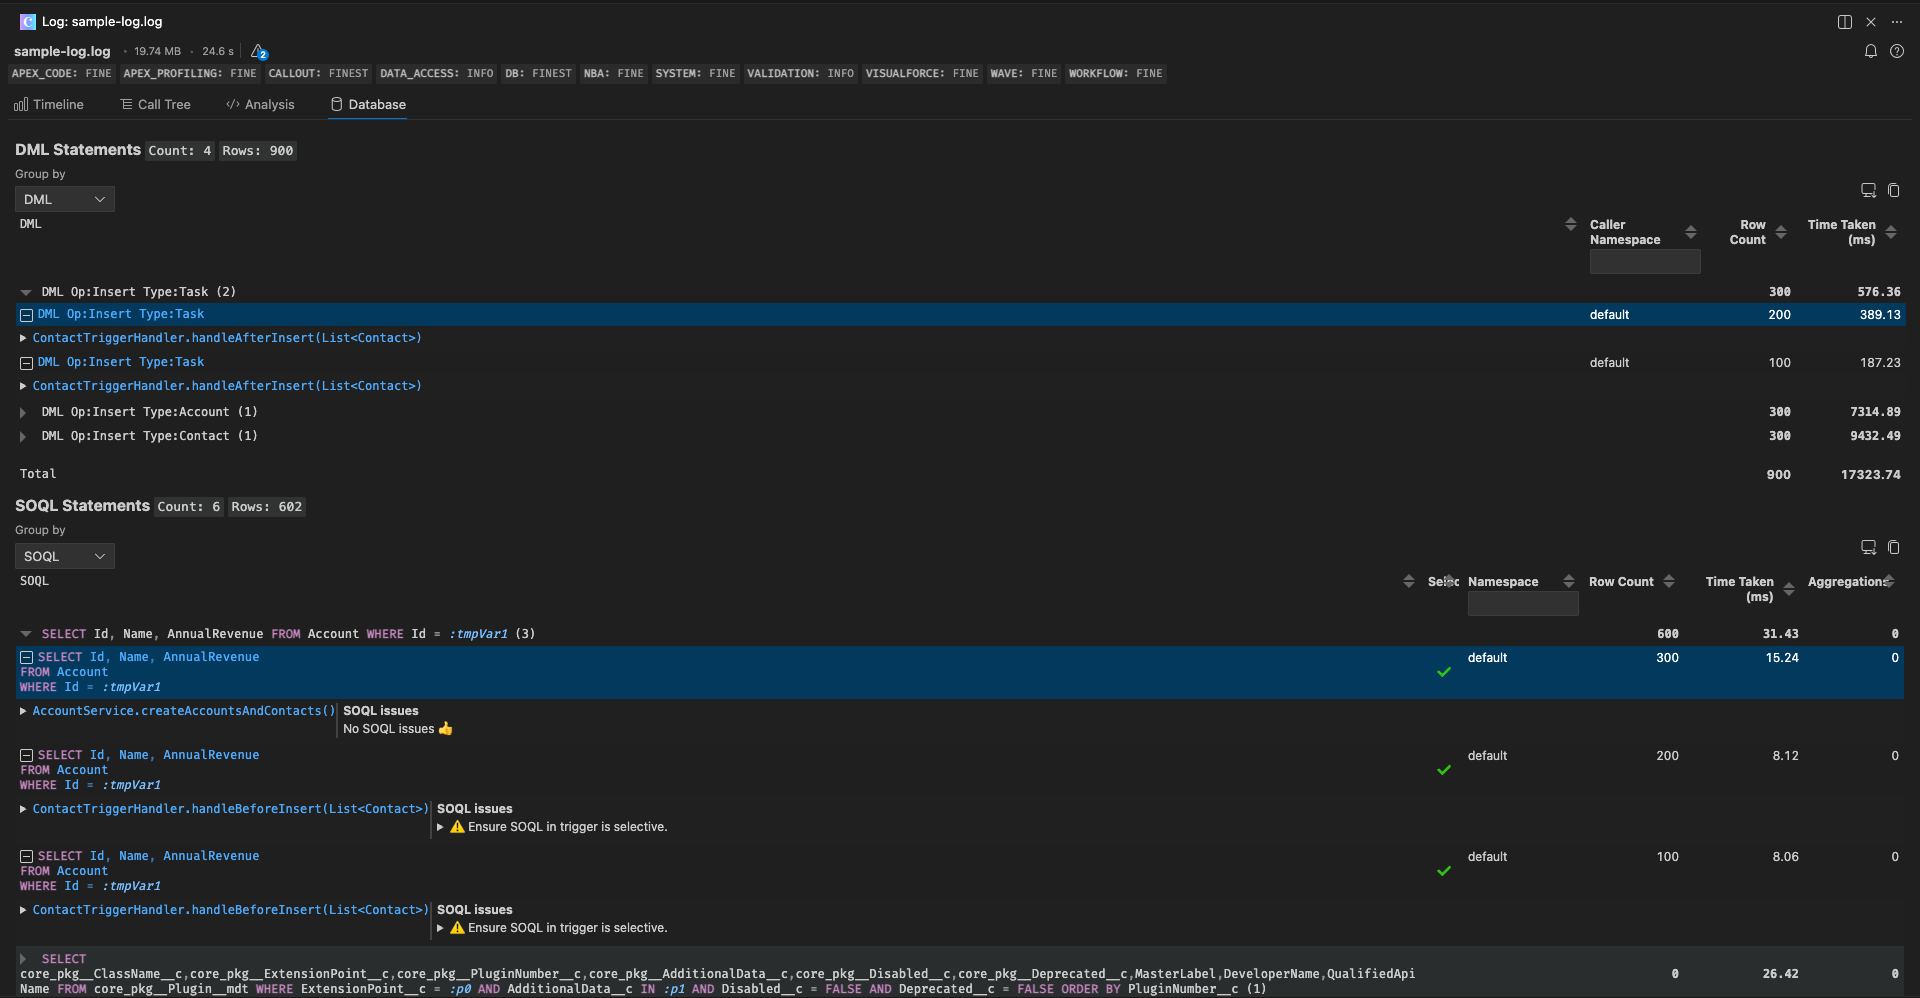
🗄️ Database Analysis
Highlight slow Salesforce SOQL queries, non-selective filters, and DML issues.
- SOQL + DML Duration, Selectivity, Aggregates, Row Count
- Group by Namespace, Caller Namespace or Query
- View the Call Stack
- SOQL Optimization Tips
- Sort by SOQL or DML, Duration, Selectivity, Aggregates, Row Count
- Copy or Export to CSV
🔍 Global Search
Search across all visualizations:
- Timeline
- Call Tree
- Analysis
- Database
Quickly step through matches, auto-expand parents, and automatically show timeline tooltips.
📄 Raw Log Navigation
Seamlessly navigate between the visual analysis and your raw .log files:
- Show in Raw Log – Right-click any frame in Timeline or Call Tree → "Show in Log File" to jump to the exact line.
- Show in Log Analysis – Hover a raw log line to see metrics and click "Show in Log Analysis" to jump back.
- Code Folding – Collapse/expand matching start/end events (METHOD_ENTRY/EXIT, DML_BEGIN/END, etc.) using the gutter icons or
Ctrl+Shift+[/]. - Line Decorations – Duration appears as ghost text at the end of the cursor line (e.g.,
1.23s (self: 45ms)). - Hover Details – Hover near the ghost text to see SOQL/DML counts, row counts, and exception info.
- Total Duration – First line displays total log execution time.
🤖 AI Assistant (MCP Server)
A companion Model Context Protocol server, @certinia/apex-log-mcp (source on GitHub), exposes Apex log analysis tools to AI assistants. Use it with GitHub Copilot Chat, Claude Code, Cursor, or any MCP client.
Available tools: get_apex_log_summary, analyze_apex_log_performance, find_performance_bottlenecks, execute_anonymous.
VS Code
Run **MCP: Add Server** from the Command Palette and add an npx server with the command npx -y @certinia/apex-log-mcp, or add it to .vscode/mcp.json:
{
  "servers": {
    "apex-log-mcp": {
      "command": "npx",
      "args": ["-y", "@certinia/apex-log-mcp"]
    }
  }
}
Claude Code
Add the server with the Claude CLI:
claude mcp add apex-log-mcp -- npx -y @certinia/apex-log-mcp
Other MCP clients
The same npm package works in Cursor and other MCP clients. See the @certinia/apex-log-mcp README for client-specific configuration snippets.
🎨 Customization
Adjust event colors with custom timeline themes in settings.json:
"lana.timeline.customThemes": {
  "Glacial Warmth": {
    "apex": "#6882A6",
    "codeUnit": "#7A9B6E",
    "system": "#9E8E7C",
    "automation": "#D98650",
    "dml": "#C85A5A",
    "soql": "#57A89A",
    "callout": "#C9A64D",
    "validation": "#8B7BAC"
  },
  "Orchid Slate": {
    "apex": "#647C96",
    "codeUnit": "#8872A8",
    "system": "#8A7E7E",
    "automation": "#C08545",
    "dml": "#C94C6E",
    "soql": "#5A9E85",
    "callout": "#B5A044",
    "validation": "#4EA6A6"
  }
}
Or go to: Preferences > Extensions > Apex Log Analyzer.
📚 Documentation
💬 Community
- All Discussions – Browse or start a discussion if nothing below fits.
- Announcements – Release notes and project updates
- Q&A – Ask usage questions
- Ideas – Suggest or discuss features
❤️ Contributors
Thanks to our amazing contributors!
📄 License
Copyright © Certinia Inc. All rights reserved.

🙏 Acknowledgments
This project uses Tabulator Tables, an open-source table library, under the MIT license. Tabulator is a powerful and flexible table library that helped with the interactive table features in the Apex Log Analyzer extension.
Additionally, the timeline color themes in Apex Log Analyzer draw inspiration from several open-source color palettes, editor themes, and UIs — including Salesforce UI, Chrome DevTools, and Firefox DevTools. We are grateful to the creators and maintainers of Catppuccin, Dracula, Nord, Solarized, Monokai Pro, Okabe–Ito, Material Design, and the broader theme communities whose work influenced the presets included in our timeline themes.
Extension points exported contracts — how you extend this code
Core symbols most depended-on inside this repo
Shape
Languages
Modules by API surface
For agents
$ claude mcp add debug-log-analyzer \
  -- python -m otcore.mcp_server <graph>