github.com/bonsairobo/bevy_metrics_dashboard @main
Chat with this repoBrowse by type
What it actually does AI analysis from the code graph — generated when you open this
README
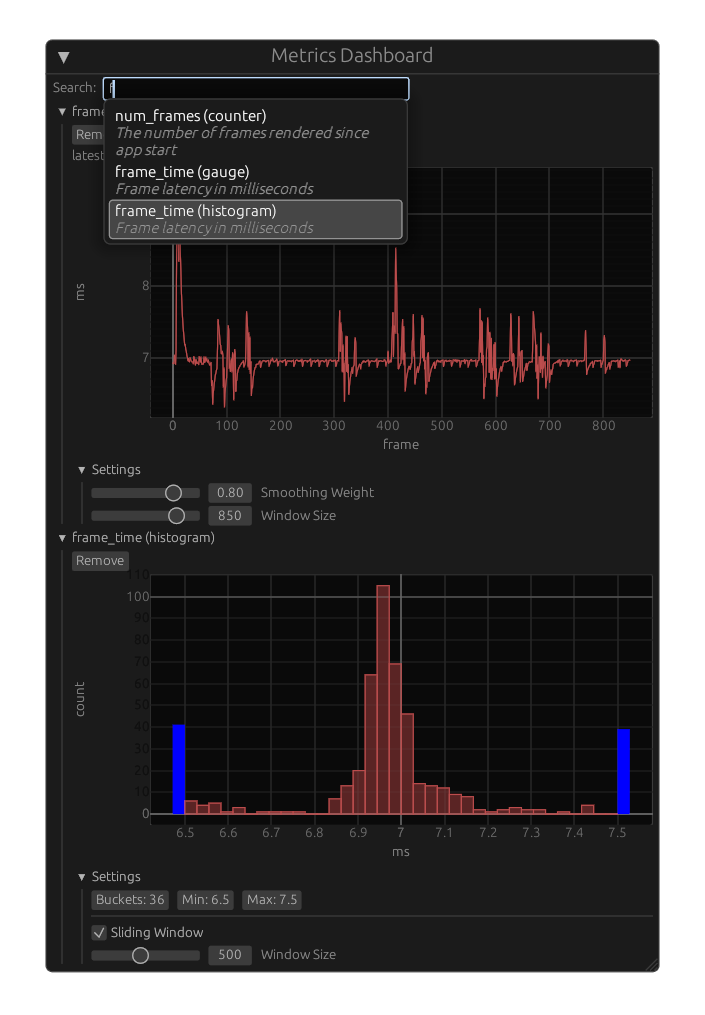
A metrics dashboard for Bevy.
This library enables Bevy apps to search and plot any metrics defined by
the metrics crate within the app itself.
Should I use this?
This library is not a replacement for tools that export metrics into a monitoring service with a time series database, nor does it reject that methodology. This library is a supplemental tool that allows users to cheaply plot high-resolution metrics in real time within the app that defines them. As such, this tool shines when you are debugging an issue that is reproducible and requires real-time feedback or ad-hoc instrumentation.
How does it work?
The metrics crate lets developers define metrics in their code using simple
macros. Each process has a global registry (AKA "recorder") of all of the
metrics that have been used or described in code.
The provided Bevy plugin defines and installs a registry, and the dashboard widget lets users search the registry and plot metrics.
Getting Started
See the "examples" directory.
Steps for plotting your metrics:
- Define metrics using the [
metrics] crate. - Add the
bevy_egui::EguiPlugin, [RegistryPlugin], andDashboardPluginto your app. You may need to enable thebevy_eguifeature. - Spawn an entity with the [
DashboardWindow] component.
Low-Level API
You can build your own metrics dashboard widgets by reusing building blocks like
the search bar and plot widgets. Read the source code of [DashboardWindow] to
see how it works.
Version Support
| bevy_metrics_dashboard | bevy | egui | bevy_egui |
|---|---|---|---|
| 0.8 | 0.16 | 0.32 | 0.36 |
| 0.7 | 0.16 | 0.31 | 0.34 |
| 0.6 | 0.15 | 0.31 | 0.33 |
| 0.5 | 0.15 | 0.31 + 0.30 | 0.32 |
| 0.4 | 0.15 | 0.30 | 0.32 |
| 0.3 | 0.14 | 0.31 + 0.29 | 0.30 |
Core symbols most depended-on inside this repo
Shape
Languages
Modules by API surface
For agents
$ claude mcp add bevy_metrics_dashboard \
  -- python -m otcore.mcp_server <graph>