github.com/ajermakovics/jvm-mon @1.3
Chat with this repoWhat it actually does AI analysis from the code graph — generated when you open this
README



jvm-mon
Console based JVM monitoring - when you just want to SSH into a server and see what's going on.
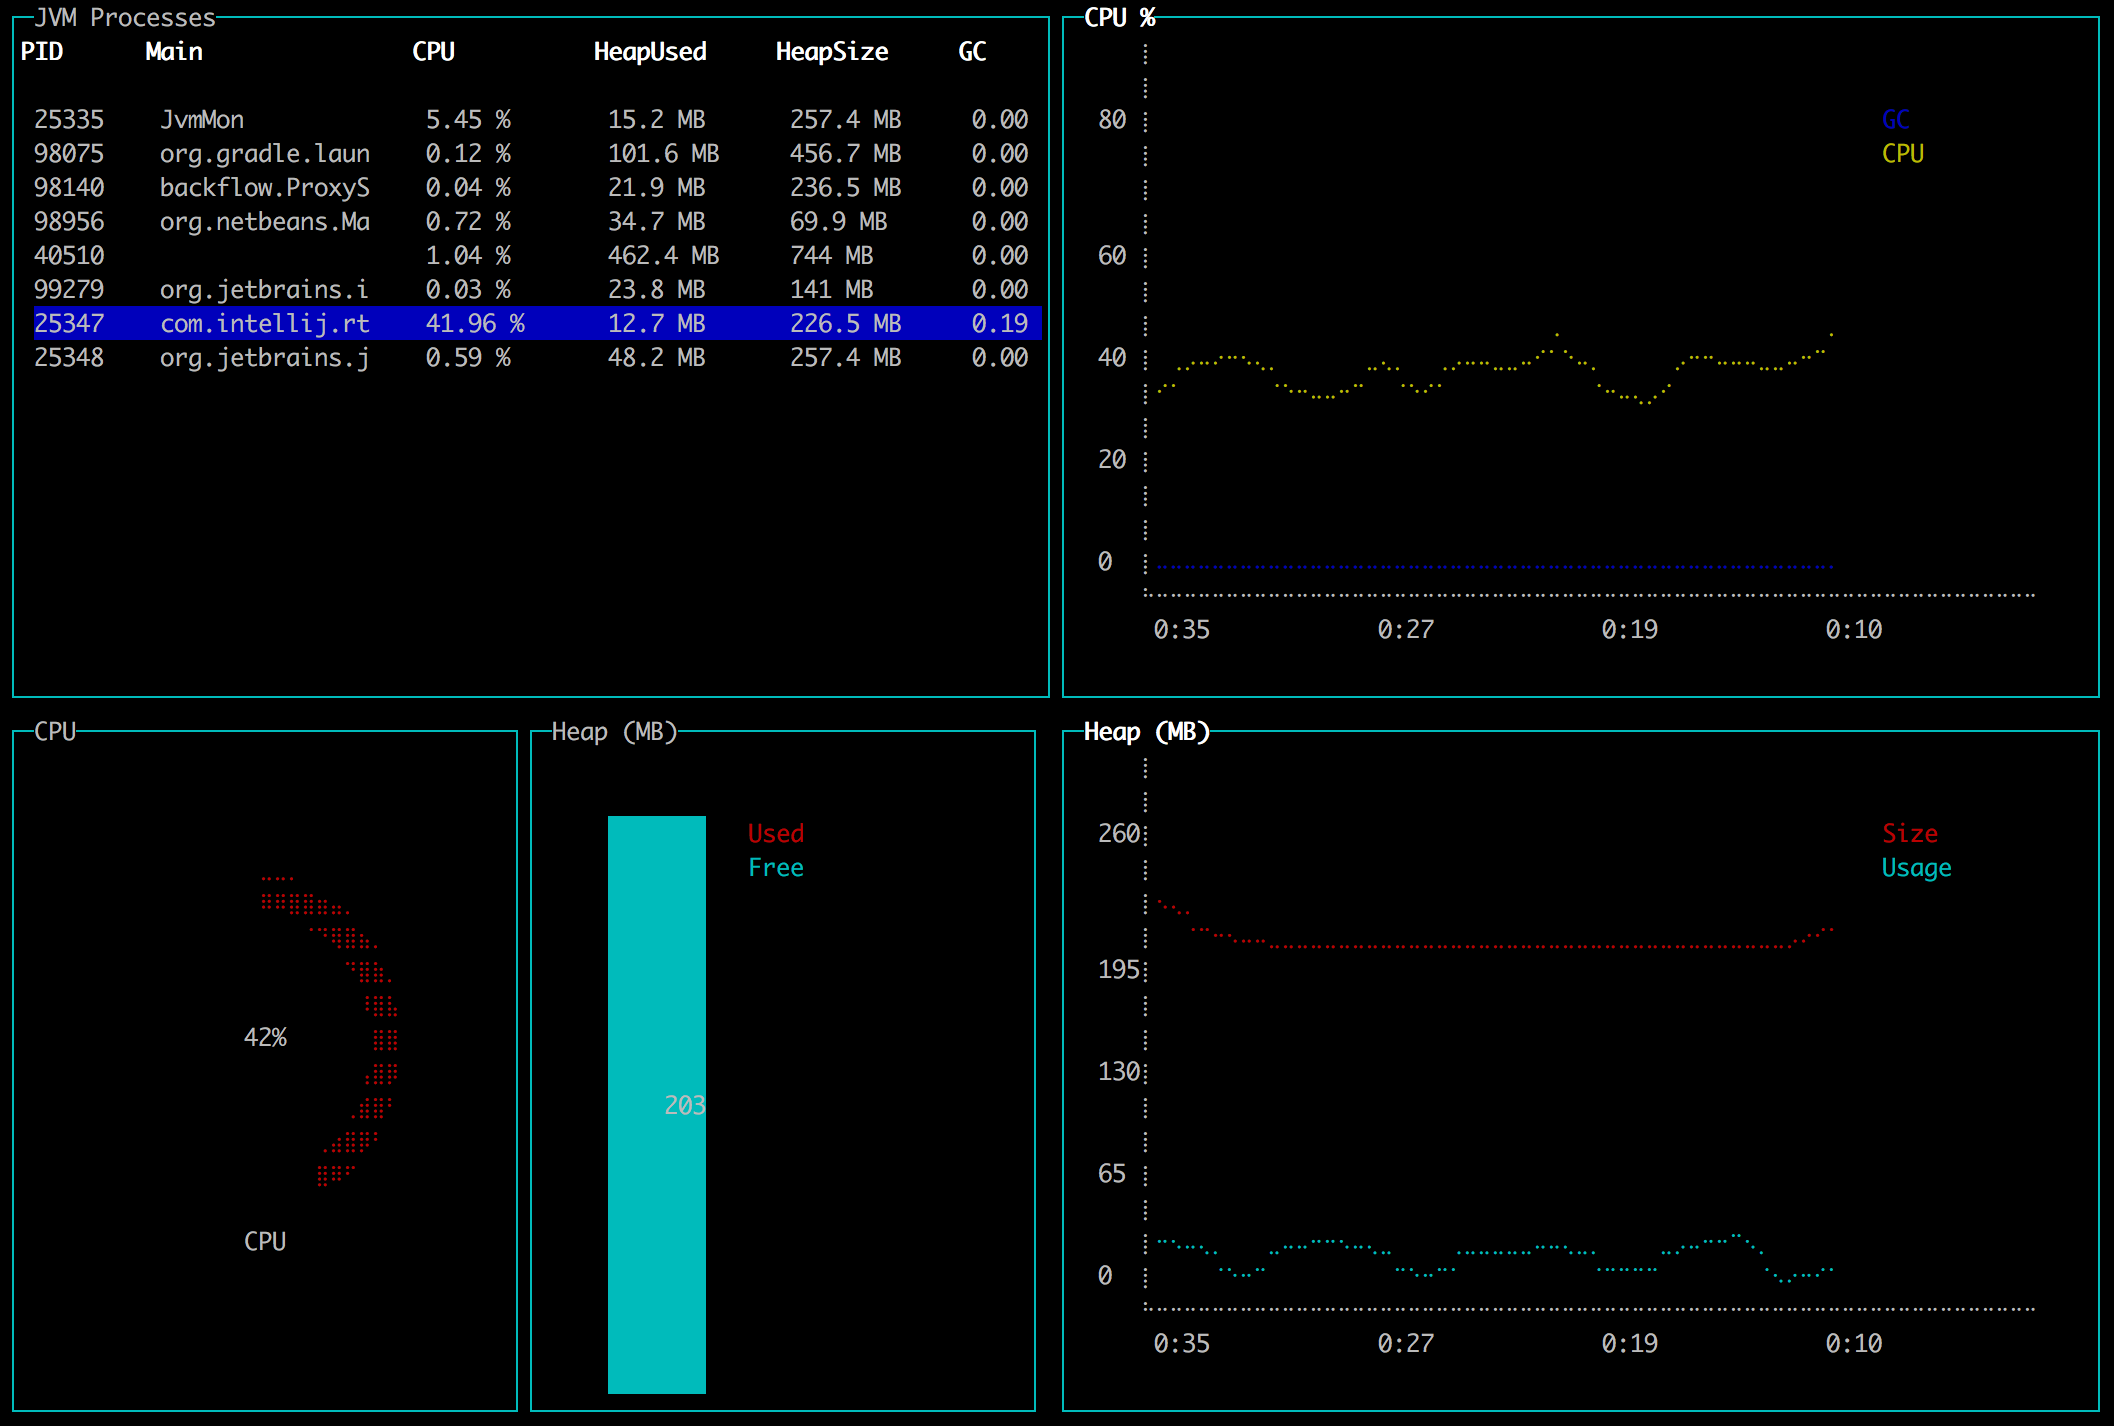
jvm-top lets you monitor your JVM server applications from the terminal.
New Version
Release: 1.2 - Rewritten in Go - Single executable file - Can monitor applications on Java 8 and above - Does not require an existing JDK
How it works: - jvm-mon executable comes bundled with a Java agent jar - On startup it extracts the agent to a temp directory - It attaches to the JVM you want to monitor - Loads agent into running JVM to collect metrics - Agent and app establish a socket connection to send metrics
Install
Download from latest release
Old version (MacOS)
Requirement: a JDK8 on the server and JAVA_HOME environment variable pointing to it. It won't work with just a JRE.
brew install jvm-mon
Usage
- Select a JVM process and press Enter to monitor it
- Press q or Ctrl+C to exit
- Press Del or Backspace to kill a process
What is available
Currently it shows: - List of running JVM processes - Cpu and GC load - Heap size and usage - Top threads with cpu usage
Building from source
To build locally run ./gradlew installDist.
Then go to ./build/install/jvm-mon/ and run ./bin/jvm-mon.
To develop you will need npm on your machine and then run ./gradlew npmDeps once to get dependencies.
How does it work?
jvm-mon is a Kotlin application based on these awesome libraries: - blessed-contrib terminal dashboard library in JavaScript - J2V8 Java Bindings for V8 JavaScript engine and Node.js - jvmtop Java monitoring for the command-line
The way it works is: 1. The Kotlin app starts a Node.js engine in-process 2. Node.js loads a script with all the widgets 3. The script calls back into Kotlin to get metrics
Extension points exported contracts — how you extend this code
Jsonable (Interface)Core symbols most depended-on inside this repo
printlnShape
Languages
Modules by API surface
For agents
$ claude mcp add jvm-mon \
  -- python -m otcore.mcp_server <graph>