github.com/Vonage/Grafana_Status_panel @v1.0.10
Chat with this repoWhat it actually does AI analysis from the code graph — generated when you open this
README
Grafana Status Panel
This is a plugin meant to be used as a centralized view for the status of component in a glance. It is very similar to the Single Stat panel, but it can hold multiple values from the same data source. Each value can be used to customize the panel in different ways:
- Mark the severity of the component
- Mark if the component is disabled
- Show extra data in the panel about the component
The General Idea
Lets say that you want to monitor a bunch of servers, and you want to keep track of multiple stats for each of them, and see in a glance the status of all of them.
This plugin will make it easier to do. You just add all the metrics you want to track, and choose how you want their values to be treated:
- Component severity marker - Set the threshold for each and you get an overview that will report to you if there is anything wrong with any of the metrics. This means that if all the metrics are in the OK state, the panel will be green. If even one of the metrics is in the WARNING state, it will be yellow, and red if any of them is CRITICAL.
- Component disable marker - Set the exact value that represents if the component is disabled, the panel will be grey.
- Display as text - show extra information about the component in the panel.
Severity and text values can be shown in 2 modes:
- Regular - under the panel title.
- Annotation - In the top left side of the panel.
Note: The disable markers are prioritized over the severity ones.
You can also repeat the panel on a template if you have multiple instances that you want to watch.
How to install (for debugging purposes only)
- Copy the contents of "Grafana_Status_panel" to the "/var/lib/grafana/plugins" folder
- Restart grafana by using "service grafana-server restart"
- Now this panel should be installed.
How to use
- Add the queries you want to the panel and give each of them a unique alias
- Choose the name of the panel to be displayed in the
Panel Titlefield. Note: this field supports Grafana templates, so if you repeat the panel the correct name will show - Go to the Options tab, and choose how to treat each metric.
- For severity display, select one of the
Thresholdoption types (Number Threshold/String Threshold/Date Threshold) underHandler Type. Enter theWarningandCriticalthresholds for each of your queries.- You can configure when the alias name and its value will be displayed in the dashboard panel by changing the fields:
Display Alias,Display Value String Thresholdoption makes equality check to the valuesNumber ThresholdandDate Thresholdoptions make range check with the values. The plugin automatically detects if higher values are good, or lower values are good by checking which threshold is higher/lower. i.e. if in your metric higher values are better, put a lower value in thecriticalthreshold than thewarningthreshold.
- You can configure when the alias name and its value will be displayed in the dashboard panel by changing the fields:
- For disable display, select the
Disable Criteriaoption type underHandler Type. Enter theDisable Valuefor each of your queries. - For display the text without any condition, select the
Text Onlyoption type underHandler Type. The alias + the value of the metric will be shown on the panel by theDisplay Typevalue.
- For severity display, select one of the
- If the query returns multiple values, choose the type of aggregation you want to be used (
Nonewill use first item from the result)
Other Features
Remove Prefix
The plugins has a 'Remove Prefix' field in the configuration. This field is meant for easier renaming of the panels when you repeat them from a Grafana template.
i.e. you recognize your servers by domain, and they are all named in the following way www.general-prefix.server.com, and you would like to remove the prefix from the display, then you enter www.general-prefix. and all the panels will only display the server.com part.
Display Value by Regex
When you want to display just part of the value for a specific metric in the screen, you can pass a regex in the Value Regex field, and if there is match, Only the first match will be displayed. Otherwise, the original value will be displayed.
Measurement URL
Lets say that you want your user to be able to get instructions on what to do when a certain metric is at Warning or Critical levels. Just put a link in this field and the name will become clickable, and send your user to the URL (like an internal wiki).
Threshold preferences
Panel display tuning is available when metric value gets to different states (ok / warning / critical / disabled):
- You can change the relevant color for each state.
- You can configure if the color will change the panel background or the metric text.
- You can change the text format (
bold/italic) for metric text inwarning/critical/disabledstates.
Show disable for no data
If there is not data from any of the metrics, you can show the panel as disabled (in Grey), by checking the value Make panel gray when no data on the top of the options tab
Supported Data Sources
Currently the plugin was tested with influxDB and Graphite. Support for other data sources could be added by demand
Release Notes
Upgrading Tips
When upgrading there might be some changes in the data the plugin uses and saves, so some of the configurations you made might be removed by accident. To prevent this loss of configuration you should save the panel JSON of all panels you have (by exporting the panel or dashboards) and keep them somewhere safe until you made sure everything is working after the upgrade.
Version 1.0.8 - What's new?
- Adding support for Grafana 5.0.x:
- Added option to auto scroll the alerts in case the text overflows the panel view
- Fix header padding when title is absent
Screenshots
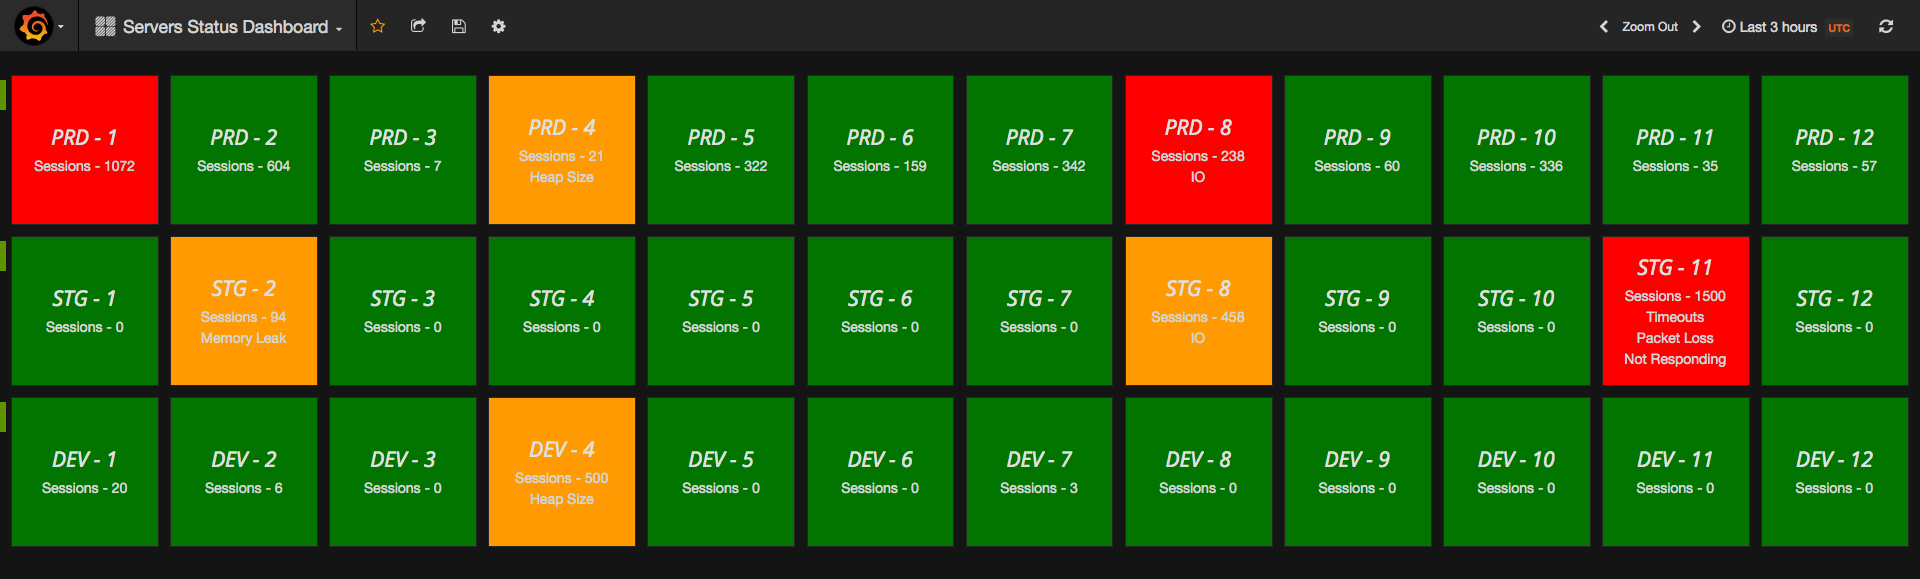
Panel States



The end result should look like this
License
See the LICENSE file for license rights and limitations (Apache License, Version 2.0)
Core symbols most depended-on inside this repo
Shape
Languages
Modules by API surface
For agents
$ claude mcp add Grafana_Status_panel \
  -- python -m otcore.mcp_server <graph>