github.com/StephanGeorg/staticmaps @v1.13.1
Chat with this repoWhat it actually does AI analysis from the code graph — generated when you open this
README
StaticMaps 
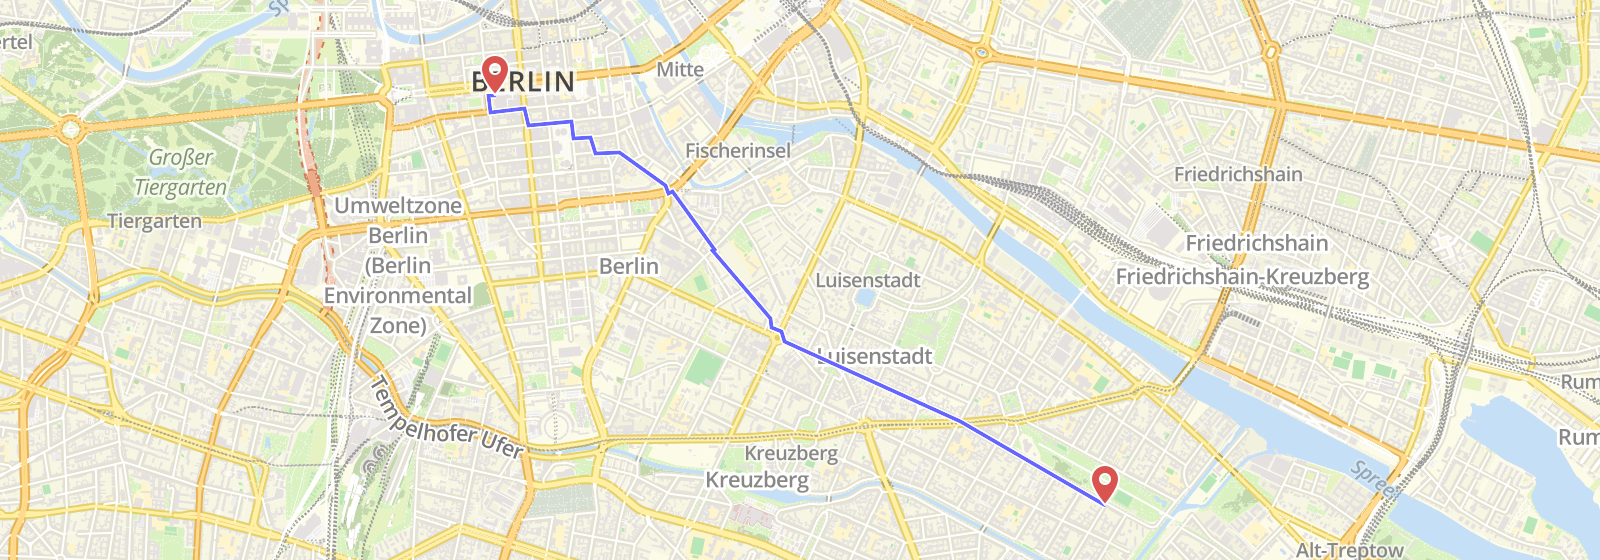
A Node.js library for creating map images with markers, polylines, polygons and text. This library is a JavaScript implementation of Static Map.
Prerequisites
Image manipulation is based on Sharp. Pre-compiled libvips binaries for sharp are provided for use with Node.js versions 14+ on macOS (x64, ARM64), Linux (x64, ARM64) and Windows (x64, x86) platforms. For other OS or using with Heroku, Docker, AWS Lambda please refer to sharp installation instructions.
Releases
| Version | sharp | libvips | Node.js (pre-compiled) |
|---|---|---|---|
| 1.13.1+ | 0.33.2 | 8.15.1 | 18.17.0+ |
| 1.12.0 | 0.31.3 | 8.13.3 | 14.15.0+ |
| 1.11.1 | 0.31.3 | 8.13.3 | 14.15.0+ |
| 1.10.0 | 0.30.7 | 8.12.2 | 12.13.0+ |
Installation
npm i staticmaps
Getting Started
Initialization
import StaticMaps from 'staticmaps';
const options = {
  width: 600,
  height: 400
};
const map = new StaticMaps(options);
Map options
| Parameter | Default | Description |
|---|---|---|
| width | Required | Width of the output image in px |
| height | Required | Height of the output image in px |
| paddingX | 0 | (optional) Minimum distance in px between map features and map border |
| paddingY | 0 | (optional) Minimum distance in px between map features and map border |
| tileUrl | (optional) Tile server URL for the map base layer or null for empty base layer. {x},{y},{z} or {quadkey} supported. |
|
| tileSubdomains | [] | (optional) Subdomains of tile server, usage ['a', 'b', 'c'] |
| tileLayers | [] | (optional) Tile layers to use, usage [{tileUrl: ..., tileSubdomains: ...}, {tileUrl: ..., tileSubdomains: ...}] (replaces tileUrl and tileSubdomains if set) |
| tileSize | 256 | (optional) Tile size in pixel |
| tileRequestTimeout | (optional) Timeout for the tiles request | |
| tileRequestHeader | {} | (optional) Additional headers for the tiles request (default: {}) |
| tileRequestLimit | 2 | (optional) Limit concurrent connections to the tiles server |
| zoomRange | { min: 1, max: 17 } | (optional) Defines the range of zoom levels to try |
| maxZoom | (optional) DEPRECATED: Use zoomRange.max instead: forces zoom to stay at least this far from the surface, useful for tile servers that error on high levels | |
| reverseY | false | (optional) If true, reverse the y index of the tiles to match the TMS naming format |
Methods
| Method | Description |
|---|---|
| addMarker | Adds a marker to the map |
| addLine | Adds a polyline to the map |
| addPolygon | Adds a polygon to the map |
| addMultiPolygon | Adds a multipolygon to the map |
| addCircle | Adds a circle to the map |
| addText | Adds text to the map |
| render | Renders the map and added features |
| image.save | Saves the map image to a file |
| image.buffer | Saves the map image to a buffer |
addMarker (options)
Adds a marker to the map.
Marker options
| Parameter | Default | Description |
|---|---|---|
| coord | Required | Coordinates of the marker ([Lng, Lat]) |
| img | Required | Marker image path or URL |
| height | Required | Height of marker image in px |
| width | Required | Width of marker image in px |
| drawHeight | height | (optional) Resize marker image to height in px |
| drawWidth | width | (optional) Resize marker image to width in px |
| resizeMode | cover | (optional) Applied resize method if needed. See: [https://sharp.pixelplumbing.com/api-resize] |
| offsetX | width/2 | (optional) X offset of the marker image in px |
| offsetY | height | (optional) Y offset of the marker image in px |
| ##### Usage example |
const marker = {
  img: `${__dirname}/marker.png`, // can also be a URL
  offsetX: 24,
  offsetY: 48,
  width: 48,
  height: 48,
  coord : [13.437524,52.4945528]
};
map.addMarker(marker);
addLine (options)
Adds a polyline to the map.
Polyline options
| Parameter | Default | Description |
|---|---|---|
| coords | Required | Coordinates of the polyline ([[Lng, Lat], ... ,[Lng, Lat]]) |
| color | #000000BB | (optional) Stroke color of the polyline |
| width | 3 | (optional) Stroke width of the polyline |
| ##### Usage example |
  const polyline = {
    coords: [
      [13.399259,52.482659],
      [13.387849,52.477144],
      [13.40538,52.510632]
    ],
    color: '#0000FFBB',
    width: 3
  };

  map.addLine(polyline);
addPolygon (options)
Adds a polygon to the map. Polygon is the same as a polyline but first and last coordinate are equal.
map.addPolygon(options);
Polygon options
| Parameter | Default | Description |
|---|---|---|
| coords | Required | Coordinates of the polygon ([[Lng, Lat], ... ,[Lng, Lat]]) |
| color | #000000BB | (optional) Stroke color of the polygon |
| width | 3 | (optional) Stroke width of the polygon |
| fill | #000000BB | (optional) Fill color of the polygon |
| ##### Usage example |
  const polygon = {
    coords: [
      [13.399259,52.482659],
      [13.387849,52.477144],
      [13.40538,52.510632],
      [13.399259,52.482659]
    ],
    color: '#0000FFBB',
    width: 3
  };

  map.addPolygon(polygon);
addMultiPolygon (options)
Adds a multipolygon to the map.
map.addMultiPolygon(options);
Multipolygon options
| Parameter | Default | Description |
|---|---|---|
| coords | Required | Coordinates of the multipolygon ([[Lng, Lat], ... ,[Lng, Lat]]) |
| color | #000000BB | (optional) Stroke color of the multipolygon |
| width | 3 | (optional) Stroke width of the multipolygon |
| fill | #000000BB | (optional) Fill color of the multipolygon |
| ##### Usage example |
  const multipolygon = {
    coords: [
      [
        [-89.9619685, 41.7792032],
        [-89.959505, 41.7792084],
        [-89.9594928, 41.7827904],
        [-89.9631906, 41.7827815],
        [-89.9632678, 41.7821559],
        [-89.9634801, 41.7805341],
        [-89.9635341, 41.780109],
        [-89.9635792, 41.7796834],
        [-89.9636183, 41.7792165],
        [-89.9619685, 41.7792032],
      ],
      [
        [-89.9631647, 41.7809413],
        [-89.9632927, 41.7809487],
        [-89.9631565, 41.781985],
        [-89.9622404, 41.7819137],
        [-89.9623616, 41.780997],
        [-89.963029, 41.7810114],
        [-89.9631647, 41.7809413],
      ],
    ],
    color: '#0000FFBB',
    width: 3
  };

  map.addMultiPolygon(multipolygon);
addCircle (options)
Adds a circle to the map.
map.addCircle(options);
Circle options
| Parameter | Default | Description |
|---|---|---|
| coord | Required | Coordinate of center of circle |
| radius | Required | Circle radius in meter |
| color | #000000BB | (optional) Stroke color of the circle |
| width | 3 | (optional) Stroke width of the circle |
| fill | #AA0000BB | (optional) Fill color of the circle |
| ##### Usage example |
  const circle = {
    coord: [13.01, 51.98],
    radius: 500,
    fill: '#000000',
    width: 0,
  };

  map.addCircle(circle);
addText (options)
Adds text to the map.
map.addText(options)
Text options
| Parameter | Default | Description |
|---|---|---|
| coord | Required | Coordinates of the text ([x, y]) |
| text | Required | The text to render |
| color | #000000BB | (optional) Stroke color of the text |
| width | 1px | (optional) Stroke width of the text |
| fill | #000000 | (optional) Fill color of the text |
| size | 12 | (optional) Font-size of the text |
| font | Arial | (optional) Font-family of the text |
| anchor | start | (optional) Anchor of the text (start, middle or end) |
| offsetX | 0 | (optional) X offset of the text in px. |
| offsetY | 0 | (optional) Y offset of the text in px. |
Usage example
  const text = {
    coord: [13.437524, 52.4945528],
    text: 'My Text',
    size: 50,
    width: 1,
    fill: '#000000',
    color: '#ffffff',
    font: 'Calibri',
    anchor: 'middle'
  };

  map.addText(text);
render (center, zoom)
Renders the map.
map.render();
Render options
| Parameter | Default | Description |
|---|---|---|
| center | (optional) Set center of map to a specific coordinate ([Lng, Lat]) | |
| zoom | (optional) Set a specific zoom level. |
image.save (fileName, [outputOptions])
Saves the image to a file in fileName.
map.image.save('my-staticmap-image.png', { compressionLevel: 9 });
Arguments
| Parameter | Default | Description |
|---|---|---|
| fileName | output.png | Name of the output file. Specify output format (png, jpg, webp) by adding file extension. |
| outputOptions | (optional) Output options set for sharp |
The outputOptions replaces the deprectated quality option. For Backwards compatibility quality still works but will be overwritten with outputOptions.quality.
Returns
<Promise>
~~If callback is undefined it return a Promise.~~ DEPRECATED
image.buffer (mime, [outputOptions])
Saves the image to a buffer.
map.image.buffer('image/jpeg', { quality: 75 });
Arguments
| Parameter | Default | Description |
|---|---|---|
| mime | image/png | Mime type(image/png, image/jpg or image/webp) of the output buffer |
| outputOptions | {} | (optional) Output options set for sharp |
The outputOptions replaces the deprectated quality option. For Backwards compatibility quality still works but will be overwritten with outputOptions.quality.
Returns
<Promise>
~~If callback is undefined it return a Promise.~~ DEPRECATED
Usage Examples
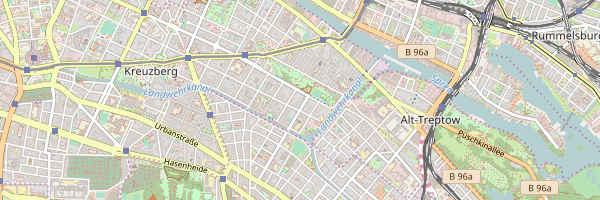
Simple map w/ zoom and center
const zoom = 13;
const center = [13.437524,52.4945528];

await map.render(center, zoom);
await map.image.save('center.png');
Output
Simple map with bounding box
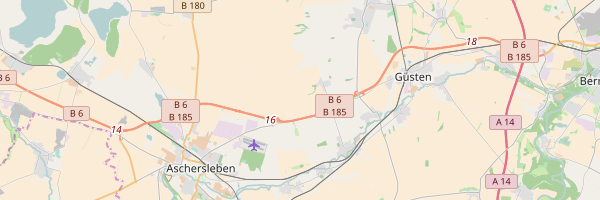
If specifying a bounding box instead of a center, the optimal zoom will be calculated.
const bbox = [
  11.414795,51.835778,  // lng,lat of first point
  11.645164,51.733833   // lng,lat of second point, ...
];

await map.render(bbox);
await map.image.save('bbox.png');
Output
Map with single marker
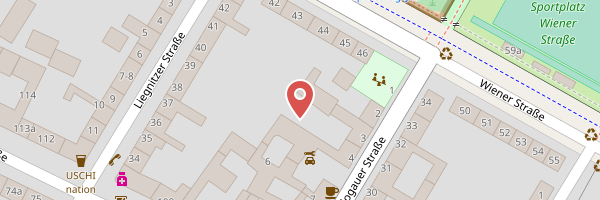
const marker = {
  img: `${__dirname}/marker.png`, // can also be a URL,
  offsetX: 24,
  offsetY: 48,
  width: 48,
  height: 48,
  coord: [13.437524, 52.4945528],
 };
map.addMarker(marker);
await map.render();
await map.image.save('single-marker.png');
You're free to specify a center as well, otherwise the marker will be centered.
Output
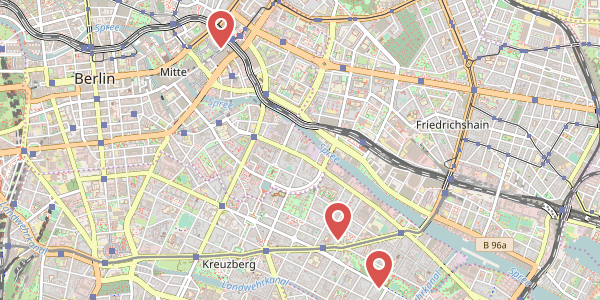
Map with multiple marker
const marker = {
  img: `${__dirname}/marker.png`, // can also be a URL
  offsetX: 24,
  offsetY: 48,
  width: 48,
  height: 48
};

marker.coord = [13.437524,52.4945528];
map.addMarker(marker);
marker.coord = [13.430524,52.4995528];
map.addMarker(marker);
marker.coord = [13.410524,52.5195528];
map.addMarker(marker);

await map.render();
await map.image.save('multiple-marker.png');
Output
Map with polyline
var line = {
  coords: [
    [13.399259,52.482659],
    [13.387849,52.477144],
    [13.40538,52.510632]
  ],
  color: '#0000FFBB',
  width: 3
};

map.addLine(line);
await map.render();
await map.image.save('test/out/polyline.png');
Output
Map with circle
```javascript
const circle =
Core symbols most depended-on inside this repo
renderShape
Languages
Modules by API surface
For agents
$ claude mcp add staticmaps \
  -- python -m otcore.mcp_server <graph>