github.com/SailingCoder/grafana-mcp-analyzer @v2.1.0
Chat with this repoWhat it actually does AI analysis from the code graph — generated when you open this
README
Grafana MCP Analyzer 🤖


Let AI directly understand your monitoring data - Intelligent DevOps Analysis Assistant
✨ Project Overview
Imagine these scenarios:
- You ask AI: "How is my server doing now?"
- AI directly checks your Grafana monitoring and responds: "CPU usage is high, recommend checking these processes..."
Complex monitoring charts analyzed by AI with one click! Say goodbye to traditional manual monitoring and let AI become your dedicated DevOps assistant!
🚀 Core Features
Grafana MCP Analyzer is based on the MCP (Model Context Protocol), empowering AI assistants like Claude and ChatGPT with the following superpowers:
- 🗣️ Natural Language Queries - Easy access to monitoring data with AI providing professional analysis in one click
- 📈 Smart Formatting - Support for large data volume analysis with efficient parsing of various data types
- 🔗 cURL Support - Direct use of browser-copied cURL commands for query composition
- 🔄 Aggregate Analysis - Single query or dashboard-level comprehensive analysis
- 🚨 Anomaly Detection - AI proactively reports performance issues with early warnings
- 🔌 Full Data Source Support - Prometheus, MySQL, ES, and all other data sources fully supported
- 💡 Professional DevOps Recommendations - Not just displaying data, but providing actionable optimization solutions to improve DevOps efficiency
- ⚡ High-Performance Architecture - Concurrent query processing, intelligent caching system, automatic error retry, supporting large-scale data analysis
🛠️ Quick Start
Step 1: Installation
npm install -g grafana-mcp-analyzer
Requirements: Node.js 18+ | Installation Guide
Step 2: Configure AI Assistant (Using Cursor as example)
{
  "mcpServers": {
    "grafana": {
      "command": "grafana-mcp-analyzer",
      "env": {
        "CONFIG_PATH": "https://raw.githubusercontent.com/SailingCoder/grafana-mcp-analyzer/main/config/grafana-config-play.js"
      }
    }
  }
}
Note: CONFIG_PATH supports absolute paths and remote paths. See Advanced Configuration below for details.
Step 3: Create Configuration File grafana-config.js
/**
 * Configuration file based on Grafana Play demo instance
 * Data source(Dogecoin OHLC data): https://play.grafana.org/d/candlesticksss/candlestick2?orgId=1&from=2021-07-13T22:13:30.740Z&to=2021-07-13T22:46:18.921Z&timezone=utc
 */
const config = {
  // Grafana server address
  baseUrl: 'https://play.grafana.org',

  // Default request headers
  defaultHeaders: {
    'Content-Type': 'application/json',
    'Accept': 'application/json, text/plain, */*'
  },

  // Health check configuration
  healthCheck: {
    url: 'api/health'
  },

  // Query definitions
  queries: {
    // First query - using curl format (Panel 2 Dogecoin data)
    'dogecoin_panel_2': {
      curl: `curl 'https://play.grafana.org/api/ds/query?ds_type=grafana-testdata-datasource&requestId=SQR108' \\
        -X POST \\
        -H 'accept: application/json, text/plain, */*' \\
        -H 'content-type: application/json' \\
        -H 'x-datasource-uid: 9cY0WtPMz' \\
        -H 'x-grafana-org-id: 1' \\
        -H 'x-panel-id: 2' \\
        -H 'x-panel-plugin-id: candlestick' \\
        -H 'x-plugin-id: grafana-testdata-datasource' \\
        --data-raw '{"queries":[{"csvFileName":"ohlc_dogecoin.csv","datasource":{"type":"grafana-testdata-datasource","uid":"9cY0WtPMz"},"refId":"A","scenarioId":"csv_file","datasourceId":153,"intervalMs":2000,"maxDataPoints":1150}],"from":"1626214410740","to":"1626216378921"}'`,
      systemPrompt: 'You are a Dogecoin data analysis expert, specializing in OHLC (Open, High, Low, Close) data analysis. Please analyze Dogecoin price data, focusing on: 1. Price trends and volatility patterns 2. Support and resistance level identification 3. Trading opportunity analysis 4. Risk assessment and recommendations 5. Technical indicator analysis. Please provide professional investment analysis and recommendations.'
    },

    // Second query - using HTTP API format (Panel 7 Dogecoin data)
    'dogecoin_panel_7': {
      url: 'api/ds/query',
      method: 'POST',
      params: {
        ds_type: 'grafana-testdata-datasource',
        requestId: 'SQR109'
      },
      headers: {
        'accept': 'application/json, text/plain, */*',
        'content-type': 'application/json',
        'x-datasource-uid': '9cY0WtPMz',
        'x-grafana-org-id': '1',
        'x-panel-id': '7',
        'x-panel-plugin-id': 'candlestick',
        'x-plugin-id': 'grafana-testdata-datasource'
      },
      data: {
        queries: [{
          csvFileName: "ohlc_dogecoin.csv",
          datasource: {
            type: "grafana-testdata-datasource",
            uid: "9cY0WtPMz"
          },
          refId: "A",
          scenarioId: "csv_file",
          datasourceId: 153,
          intervalMs: 2000,
          maxDataPoints: 1150
        }],
        from: "1626214410740",
        to: "1626216378921"
      },
      systemPrompt: 'You are a financial market technical analysis expert, specializing in cryptocurrency market analysis. Please analyze Dogecoin market data, focusing on: 1. Market trends and momentum analysis 2. Price pattern recognition (head and shoulders, double bottom, etc.) 3. Volume and price relationship 4. Market sentiment assessment 5. Short-term and long-term investment strategy recommendations. Please provide detailed technical analysis reports.'
    }
  }
};

module.exports = config;
Configuration Retrieval Tips:
Copy cURL command from browser (Recommended):
- Execute query in Grafana
- Press F12 to open developer tools → Network tab
- Find query request → Right-click → Copy as cURL
HTTP API configuration:
- Get Data parameters: Go to chart → "Query Inspector" → "JSON" parse → Copy request body (request)
- Get URL and Headers Token: View request parameters through Network panel, manually construct HTTP configuration.
Configuration file examples can be found at: Basic Configuration and Remote Real Configuration
Step 4: Start Using
Completely restart Cursor, then experience intelligent analysis:
👤 You: Analyze dogecoin_panel_2 data\ 🤖 AI: Connecting to Grafana and analyzing...
👤 You: Aggregate analyze dogecoin_panel_2 and dogecoin_panel_7 data\ 🤖 AI: Simultaneously querying multiple indicators and performing comprehensive correlation analysis...
Configuration Complete!
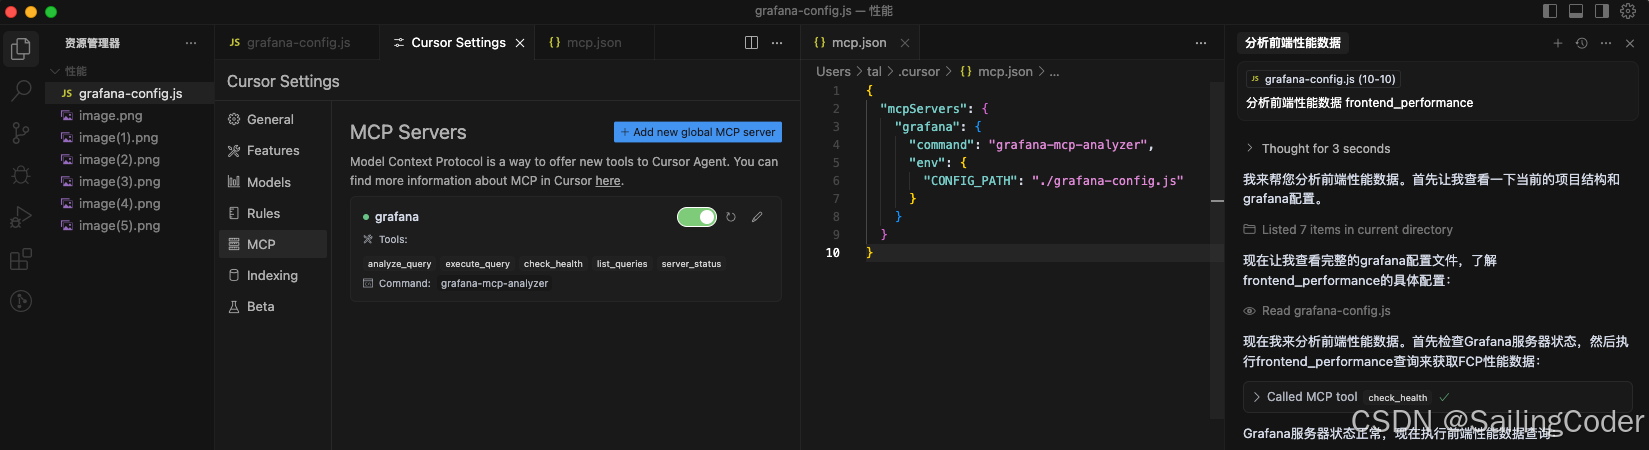
MCP Tools List
| Tool | Function | Use Case |
|---|---|---|
analyze_query |
Query+AI Analysis | Need professional recommendations |
query_data |
Raw data query | Only need data |
aggregate_analyze |
Aggregate analysis | Unified analysis of multiple queries |
list_queries |
Query list | View configuration |
check_health |
Health check | Status monitoring |
manage_sessions |
Session management | Manage analysis sessions |
list_data |
Data list | View stored data |
server_status |
Server status | Server information |
Tool Usage
// AI assistant will automatically select appropriate tools
👤 "Analyze CPU usage" → 🤖 Calls analyze_query
👤 "Aggregate analyze system metrics" → 🤖 Calls aggregate_analyze
👤 "Get memory data" → 🤖 Calls query_data
👤 "Check service status" → 🤖 Calls check_health
👤 "What monitoring queries are available" → 🤖 Calls list_queries
👤 "Aggregate analyze system metrics" → 🤖 Calls aggregate_analyze
Advanced Configuration
Configuration Support: Absolute paths, Remote paths
1. Remote Paths
Supports accessing remote configuration files via HTTPS URLs, suitable for team collaboration and multi-environment deployments:
{
  "mcpServers": {
    "grafana": {
      "command": "grafana-mcp-analyzer",
      "env": {
        "CONFIG_PATH": "https://raw.githubusercontent.com/SailingCoder/grafana-mcp-analyzer/main/config/grafana-config-play.js",
        "CONFIG_MAX_AGE": "600"
      }
    }
  }
}
Supported remote storage:
- Alibaba Cloud OSS:
https://bucket.oss-cn-hangzhou.aliyuncs.com/config.js - Tencent Cloud COS:
https://bucket-123.cos.ap-shanghai.myqcloud.com/config.js - AWS S3:
https://bucket.s3.amazonaws.com/config.js - GitHub Raw:
https://raw.githubusercontent.com/user/repo/main/config.js
Please note, as follows:
❌ GitHub Page https://github.com/user/repo/blob/main/file.js Return to HTML page ✅ GitHub Raw https://raw.githubusercontent.com/user/repo/main/file.js Return the original file
2. Absolute Paths
Also supports configuring local absolute paths for quick configuration and analysis:
{
  "mcpServers": {
    "grafana": {
      "command": "grafana-mcp-analyzer",
      "env": {
        "CONFIG_PATH": "/Users/your-username/project/grafana-config.js"
      }
    }
  }
}
Environment Variables
| Variable | Default | Description |
|---|---|---|
CONFIG_PATH |
Required | Configuration file path (local path or HTTPS URL) |
CONFIG_MAX_AGE |
300 |
Remote configuration cache time (seconds), set to 0 to disable cache |
Cache features:
- Smart caching: Default 5-minute cache, improves access speed
- Fault tolerance: Automatically uses expired cache when network fails
- Auto cleanup: Automatically cleans expired cache files on startup
- Real-time updates: Set CONFIG_MAX_AGE=0 to disable cache and get latest configuration every time
Command Line Options
# Show version information
grafana-mcp-analyzer -v
grafana-mcp-analyzer --version

# Show help information
grafana-mcp-analyzer -h
grafana-mcp-analyzer --help
Environment Variables Configuration
export GRAFANA_URL="https://your-grafana.com"
export GRAFANA_TOKEN="your-api-token"
Configuration Examples
Business Scenarios
E-commerce Business Analysis
// E-commerce conversion rate analysis
ecommerce_conversion: {
  curl: `curl 'api/ds/query' \\
    -X POST \\
    -H 'Content-Type: application/json' \\
    -d '{"queries":[{"refId":"A","expr":"rate(orders_total[5m]) / rate(page_views_total[5m]) * 100","range":{"from":"now-24h","to":"now"}}]}'`,
  systemPrompt: 'You are an e-commerce business analysis expert, specializing in conversion rate optimization and user purchase behavior analysis. Please analyze sales conversion rate data, focusing on: 1. Conversion rate trend changes and key inflection points 2. Peak and valley period identification 3. User purchase behavior patterns 4. Key factors affecting conversion 5. Conversion rate optimization recommendations and A/B testing plans 6. Expected revenue assessment. Please provide specific business improvement recommendations.'
}
Financial Data Analysis
// Transaction volume analysis
finance_transactions: {
  curl: `curl 'api/ds/query' \\
    -X POST \\
    -H 'Content-Type: application/json' \\
    -d '{"queries":[{"refId":"A","expr":"sum(rate(transaction_amount_total[5m]))","range":{"from":"now-7d","to":"now"}}]}'`,
  systemPrompt: 'You are a financial data analysis expert, specializing in transaction risk control and business growth analysis. Please analyze transaction volume data, focusing on: 1. Transaction volume trends and cyclical patterns 2. Abnormal transaction pattern identification 3. Risk signal detection 4. Business growth opportunities 5. Risk control strategy optimization recommendations 6. Compliance assessment. Please provide balanced recommendations for risk control and business growth.'
},

// Revenue analysis
revenue_analysis: {
  curl: `curl 'api/ds/query' \\
    -X POST \\
    -H 'Content-Type: application/json' \\
    -d '{"queries":[{"refId":"A","expr":"sum(increase(revenue_total[1d]))","range":{"from":"now-90d","to":"now"}}]}'`,
  systemPrompt: 'You are a financial data analysis expert, focusing on revenue growth and profitability analysis. Please analyze revenue data, focusing on: 1. Revenue trends and growth pattern analysis 2. Revenue source structure and contribution 3. Seasonal and cyclical factor impacts 4. Revenue forecasting and target achievement analysis 5. Profitability and cost-effectiveness assessment 6. Revenue growth strategy recommendations.'
}
User Behavior Analysis
``javascript
// User activity analysis
user_activity: {
  curl:
curl 'api/ds/query' \
-X POST \
-H 'Content-Type: application/json' \
-d '{"queries":[{"refId":"A","expr":"count(increase(user_sessions_total[1h]))","range":{"from":"now-30d","to":"now"}}]}'`,
systemPrompt: 'You are a user behavior analysis expert, focusing on user retention and engagement optimization. Please analyze user activity data, focusing on: 1. User activity trends and retention rates 2. User behavior patterns and preferences 3. User lifecycle analysis 4. At-risk user identification 5. User engagement improvement strategies 6. Personalized recommendation suggestions.'
},
// Content consumption analysis content_engagement: { curl: `curl 'api/ds/query' \
Extension points exported contracts — how you extend this code
Core symbols most depended-on inside this repo
Shape
Languages
Modules by API surface
Datastores touched
For agents
$ claude mcp add grafana-mcp-analyzer \
  -- python -m otcore.mcp_server <graph>