github.com/RobKuebler/mamimo @v0.4.3
Chat with this repoWhat it actually does AI analysis from the code graph — generated when you open this
README
MaMiMo
This is a small library that helps you with your everyday Marketing Mix Modelling. It contains a few saturation functions, carryovers and some utilities for creating with time features. You can also read my article about it here: >>>Click<<<.
Give it a try via pip install mamimo!
Small Example
You can create a marketing mix model using different components from MaMiMo as well as scikit-learn. First, we can create a dataset via
from mamimo.datasets import load_fake_mmm

data = load_fake_mmm()

X = data.drop(columns=['Sales'])
y = data['Sales']
X contains media spends only now, but you can enrich it with more information.
Feature Engineering
MaMiMo lets you add time features, for example, via
from mamimo.time_utils import add_time_features, add_date_indicators


X = (X
     .pipe(add_time_features, month=True)
     .pipe(add_date_indicators, special_date=["2020-01-05"])
     .assign(trend=range(200))
)
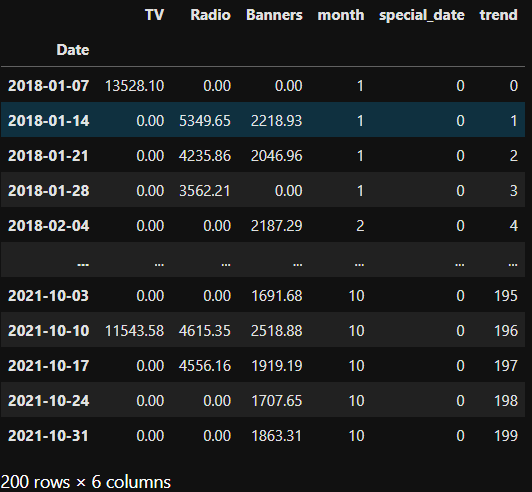
This adds
- a month column (integers between 1 and 12),
- a binary column named special_date that is 1 on the 5h of January 2020 and 0 everywhere else, and
- a (so far linear) trend which is only counting up from 0 to 199.
X looks like this now:
Building a Model
We can now build a final model like this:
from mamimo.time_utils import PowerTrend
from mamimo.carryover import ExponentialCarryover
from mamimo.saturation import ExponentialSaturation
from sklearn.linear_model import LinearRegression
from sklearn.preprocessing import OneHotEncoder
from sklearn.compose import ColumnTransformer
from sklearn.pipeline import Pipeline

cats =  [list(range(1, 13))] # different months, known beforehand

preprocess = ColumnTransformer(
    [
     ('tv_pipe', Pipeline([
            ('carryover', ExponentialCarryover()),
            ('saturation', ExponentialSaturation())
     ]), ['TV']),
     ('radio_pipe', Pipeline([
            ('carryover', ExponentialCarryover()),
            ('saturation', ExponentialSaturation())
     ]), ['Radio']),
     ('banners_pipe', Pipeline([
            ('carryover', ExponentialCarryover()),
            ('saturation', ExponentialSaturation())
     ]), ['Banners']),
    ('month', OneHotEncoder(sparse=False, categories=cats), ['month']),
    ('trend', PowerTrend(), ['trend']),
    ('special_date', ExponentialCarryover(), ['special_date'])
    ]
)

model = Pipeline([
    ('preprocess', preprocess),
    ('regression', LinearRegression(
        positive=True,
        fit_intercept=False # no intercept because of the months
        )
    )
])
This builds a model that does the following: - the media channels are preprocessed using the adstock transformation, i.e. a carryover effect and a saturation is added - the month is one-hot (dummy) encoded - the trend is changed from linear to something like t^a, with some exponent a to be optimized - the special_date 2020-01-05 gets a carryover effect as well, meaning that not only on this special week there was some special effect on the sales, but also the weeks after it
Training The Model
We can then hyperparameter tune the model via
from scipy.stats import randint, uniform
from sklearn.model_selection import RandomizedSearchCV, TimeSeriesSplit

tuned_model = RandomizedSearchCV(
    model,
    param_distributions={
        'preprocess__tv_pipe__carryover__window': randint(1, 10),
        'preprocess__tv_pipe__carryover__strength': uniform(0, 1),
        'preprocess__tv_pipe__saturation__exponent': uniform(0, 1),
        'preprocess__radio_pipe__carryover__window': randint(1, 10),
        'preprocess__radio_pipe__carryover__strength': uniform(0, 1),
        'preprocess__radio_pipe__saturation__exponent': uniform(0, 1),
        'preprocess__banners_pipe__carryover__window': randint(1, 10),
        'preprocess__banners_pipe__carryover__strength': uniform(0, 1),
        'preprocess__banners_pipe__saturation__exponent': uniform(0, 1),
        'preprocess__trend__power': uniform(0, 2),
        'preprocess__special_date__window': randint(1, 10),
        'preprocess__special_date__strength': uniform(0, 1),
    },
    cv=TimeSeriesSplit(),
    random_state=0,
    n_iter=1000, # can take some time, lower number for faster results
)

tuned_model.fit(X, y)
You can also use GridSearch, Optuna, or other hyperparameter tune methods and packages here, as long as it is compatible to scikit-learn.
Analyzing
With tuned_model.predict(X) and some plotting, we get
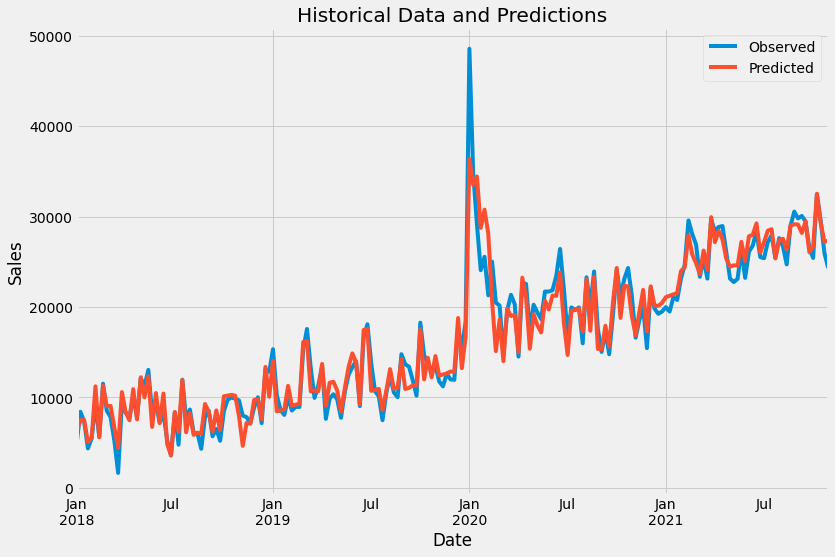
You can get the best found hyperparameters using print(tuned_model.best_params_).
Plotting
You can compute the channel contributions via
from mamimo.analysis import breakdown

contributions = breakdown(tuned_model.best_estimator_, X, y)
This returns a dataframe with the contributions of each channel fo each time step, summing to the historical values present in y. You can get a nice plot via
ax = contributions.plot.area(
    figsize=(16, 10),
    linewidth=1,
    title="Predicted Sales and Breakdown",
    ylabel="Sales",
    xlabel="Date",
)
handles, labels = ax.get_legend_handles_labels()
ax.legend(
    handles[::-1],
    labels[::-1],
    title="Channels",
    loc="center left",
    bbox_to_anchor=(1.01, 0.5),
)
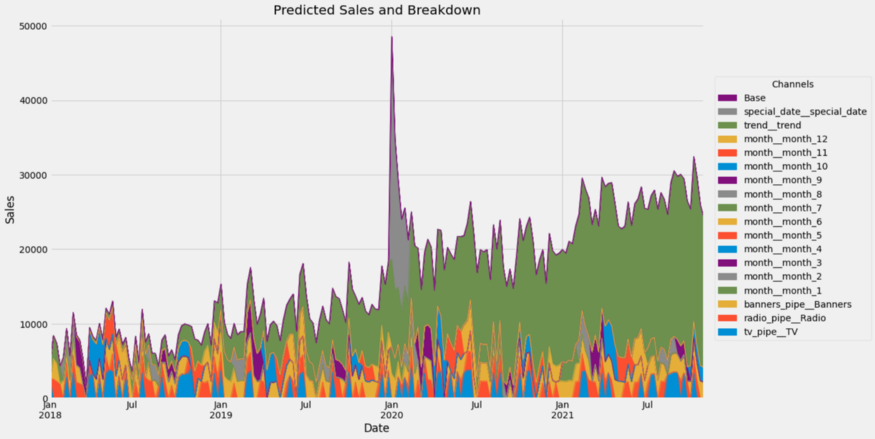
Wow, that's a lot of channels. Let us group some of them together.
group_channels = {'Baseline': [f'month__month_{i}' for i in range(1, 13)] + ['Base', 'trend__trend']}
# read: 'Baseline consists of the months, base and trend.'
# You can add more groups!

contributions = breakdown(
    tuned_model.best_estimator_,
    X,
    y,
    group_channels
)
If we plot again, we get
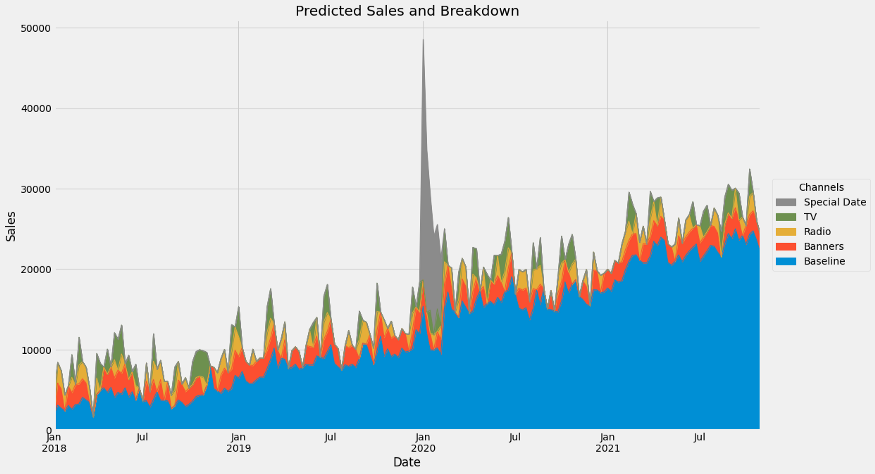
Yay!

Core symbols most depended-on inside this repo
fitShape
Languages
Modules by API surface
For agents
$ claude mcp add mamimo \
  -- python -m otcore.mcp_server <graph>