github.com/Richardsl/heatmap-calendar-obsidian @0.7.1
Chat with this repoWhat it actually does AI analysis from the code graph — generated when you open this
README
Heatmap Calendar plugin for Obsidian
Visualize your data in a heatmap calendar similar to the github activity calendar using this Obsidian plugin.
Useful for tracking progress for exercise, finances, social time, project progression, passions, vices etc.
To be used with Obsidian Dataview, but could be used standalone or with other plugins aswell (if you know some javascript).
<img alt="Shows a black logo in light color mode and a white one in dark color mode." src="https://user-images.githubusercontent.com/25423296/163456779-a8556205-d0a5-45e2-ac17-42d089e3c3f8.png">
Howto
-
Annotate the data you want to track in your daily notes (see Dataview annotation documentation)
-
Create a DataviewJS block where you want the Heatmap Calendar to display.
-
Collect the data you want to display using DataviewJS
-
Pass the data into Heatmap Calendar using renderHeatmapCalendar()
Visualized Concept:

Full Example Code:
\```dataviewjs // PS. remove backslash \ at the very beginning!

dv.span("** 😊 Title  😥**") /* optional ⏹️💤⚡⚠🧩↑↓⏳📔💾📁📝🔄📝🔀⌨️🕸️📅🔍✨ */
const calendarData = {
    year: 2022,  // (optional) defaults to current year
    colors: {    // (optional) defaults to green
        blue:        ["#8cb9ff", "#69a3ff", "#428bff", "#1872ff", "#0058e2"], // first entry is considered default if supplied
        green:       ["#c6e48b", "#7bc96f", "#49af5d", "#2e8840", "#196127"],
        red:         ["#ff9e82", "#ff7b55", "#ff4d1a", "#e73400", "#bd2a00"],
        orange:      ["#ffa244", "#fd7f00", "#dd6f00", "#bf6000", "#9b4e00"],
        pink:        ["#ff96cb", "#ff70b8", "#ff3a9d", "#ee0077", "#c30062"],
        orangeToRed: ["#ffdf04", "#ffbe04", "#ff9a03", "#ff6d02", "#ff2c01"]
    },
    showCurrentDayBorder: true, // (optional) defaults to true
    defaultEntryIntensity: 4,   // (optional) defaults to 4
    intensityScaleStart: 10,    // (optional) defaults to lowest value passed to entries.intensity
    intensityScaleEnd: 100,     // (optional) defaults to highest value passed to entries.intensity
    entries: [],                // (required) populated in the DataviewJS loop below
}

//DataviewJS loop
for (let page of dv.pages('"daily notes"').where(p => p.exercise)) {
    //dv.span("

" + page.file.name) // uncomment for troubleshooting
    calendarData.entries.push({
        date: page.file.name,     // (required) Format YYYY-MM-DD
        intensity: page.exercise, // (required) the data you want to track, will map color intensities automatically
        content: "🏋️",           // (optional) Add text to the date cell
        color: "orange",          // (optional) Reference from *calendarData.colors*. If no color is supplied; colors[0] is used
    })
}

renderHeatmapCalendar(this.container, calendarData)

```
Colors:
The heatmap uses a green color scheme by default, just like Github.
Default Color: green (no color specified)

Custom Color
You can customize the colors of the heatmap by supplying a color array to calendarData.colors:

More color options
Multi-Color:
You can use multiple colors to display different data-entries in the same heatmap. Specifying the name you gave the color in calendarData.colors (eg. "blue", "pink" etc).

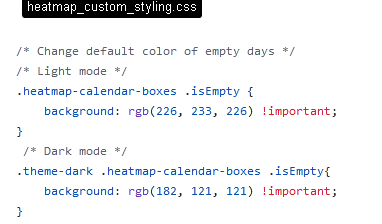
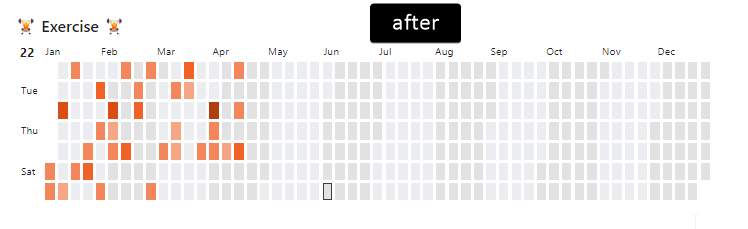
Styling Background (empty days):
Use Obsidian's built in "CSS snippets" for custom styling including styling the empty days (aka the background cells).
But remember this will affect all of you heatmaps in all of your notes.

Global color schemes via settings:
You can also add a color scheme via the Settings panel. This scheme which will be available everywhere.
In order to do so go to Obsidian Settings > Heatmap Calendar, you will see a list of available colors, and you can add your own. You must specify a “Color name” by which you will reference it in your render call, and provide a valid array of colors.
When you do so, you can now reference your scheme everywhere by passing your name to the colors option. For example, let's say you have defined a new color called githubGreen. Now, in your code, you can reference it like so:
```dataviewjs
const calendarData = {
    colors: "githubGreen",
    entries: [],
}

renderHeatmapCalendar(this.container, calendarData)
```
The color schemes used in the examples were created at leonardocolor.io.
Data Intensity:
Set which intensity of color to use (eg. from light-green to dark-green etc).

More
They color-range will be distributed between the highest and lowest number you pass to "intensity".
If the number range 0-100 is used, numbers between 1-20 would map to the lightest color, 40-60 would map to mid intensity color, and 80-100 would map to max intensity. You can add more intensities in order to increase color resolution; simply supply more colors to calendarData.colors.yourcolor
Dataview's time variables are supported without any conversion, as they return milliseconds by default.
[time:: 1 hours, 35 minutes] => intensity: page.time
Other Notes:
- See the EXAMPLE VAULT if you want to test out the examples.
- Week start day is configurable
- Date format is YYYY-MM-DD, if your daily note filename is something else, you can use JS to change it in the loop
- Use Obsidian CSS snippets for custom styling. See snippet examples.
Development (Windows):
npm run dev - will start an automatic TS to JS transpiler and automatically copy the generated JS/CSS/manifest files to the example vault when modified (Remember to run npm install first).
After the files have been transpiled, the hot-reload plugin (https://github.com/pjeby/hot-reload) then reloads Obsidian automatically.
Hot-reload is installed in the example vault by default. its used to avoid restarting obsidian after every change to code.
(remember to add an empty .hotreload file to "EXAMPLE_VAULT/.obsidian/plugins/heatmap-calendar/" if not already present, as this tells hot-reload to watch for changes)
npm run build generates the files ready for distribution.
Tip: ctrl-shift-i opens the devtools inside Obsidian.
Technical Explanation
All the plugin does, is add the function renderHeatmapCalendar() to the global namespace of you vault.
"this.container" is passed as the first argument because the plugin needs to know where to render the calendar. You don't have to worry about this.
"renderHeatmapCalendar()" then takes "calendarData" as the secondary argument. This is the javascript object you have to create yourself in order to give plugin instructions and data. Most of the properties are optional, but you have to supply an entries array as an absolute minimum.
See the beginning of the readme for the full code example.
absolute minimum code example:
\```dataviewjs

const calendarData = {
    entries: [],
}

renderHeatmapCalendar(this.container, calendarData)

```
What's New:
Version [0.7.1] - 2024-06-28
fix styling bug
Version [0.7.0] - 2024-06-04
New "First day of the week" setting, Thanks @antosha417
New setting for changing the first day of the week, ie. Sunday/Monday.
For the American users :-)

Thanks @antosha417
Alternating Month Styling, Thanks @lksrpp
The months now how their own classes so that they can be styled individually.
The example CSS Snippet below can be found in the EXAMPLE_VAULT in the "./obsidian/snippets" folder:

Thanks @lksrpp
Tighter Heatmap Margins/paddings, Thanks @Chailotl
New setting for

Thanks @Chailotl
Version [0.6.0] - 2023-04-12 - Feature: Add ability to define global colors via settings @sunyatasattva pull #74 - Feature: Add more versatile custom styling of the "content" passed to date cell @sunyatasattva pull #73
Version [0.5.0] - 2022-06-30 - Feature: Add darkmode support
Version [0.4.0] - 2022-06-25
- Feature: Add hover preview feature courtesy of @arsenty from issue #12.
to enable - add content: await dv.span([](${page.file.name})) to entries, and enable Settings -> Core Plugins -> Page Preview.
Optionally install plugin Metatable to display metadata/frontmatter in the preview window aswell.
See examples for more details. Note: if you enabled Use [[Wikilinks]] under Settings -> Files and links, you have to use the respective link structure: content: await dv.span([[${page.file.name}|]])
Version [0.3.0] - 2022-06-25 - Feature: Can add more intensities in order to increase color resolution. simply supply more colors to calendarData.colors.yourcolor - Feature: Can set custom range on the intensity scaling using intensityScaleStart and intensityScaleEnd - Bugfix: Entries from other years would show up in the calendar
Version [0.2.0] - 2022-06-05 - Feature: Add border around todays box to indicate what day it is. Can be removed by setting showCurrentDayBorder to false - Feature: Add better development solution/workflow by using automated file copying instead of symlinks
Version [0.1.1] - 2022-03-18 - Bugfix: fix major date problem where year would render with incorrect number of days for different timezones issue#4. - Bugfix: fix problem with certain entries not showing up in the correct month - Bugfix: fix grid cells not scaling correctly with browser width, especially content in grid cells
Version [0.1.0] - 2022-02-23 - initial release
Extension points exported contracts — how you extend this code
Core symbols most depended-on inside this repo
Shape
Languages
Modules by API surface
For agents
$ claude mcp add heatmap-calendar-obsidian \
  -- python -m otcore.mcp_server <graph>