github.com/Packet-Clearing-House/maptable @2.7.4
Chat with this repoWhat it actually does AI analysis from the code graph — generated when you open this
README
MapTable


MapTable's primary function is to convert any dataset to a customizable set of components of Map, Filters and Table:
- Map - A fully customizable (zoom & pan) choropleth or heat map rendered using SVG. The map can be exported to a stand alone SVG for external consumption. The map can include markers based on lat/lon with tooltips. Markers and Map are dynamically update based on filters.
- Table - A tabular representation of your dataset which can be sorted by header rows. Primary sort is the first click and secondary sort is the second click when shift is held down. This also dynamically responds to filters.
- Filters - A programmatically generated list of drop downs and input fields to drill down into your dataset
This library was originally conceived to render the home page and next generation of IXP directory for Packet Clearing House (PCH).
You can also browse other code samples and examples
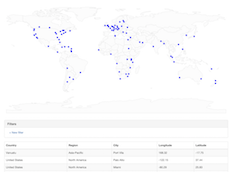
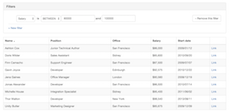
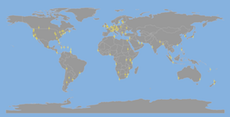
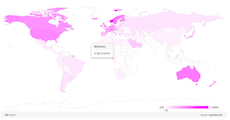
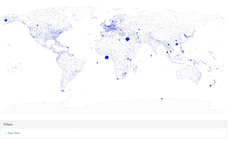
Table of Contents
- Import datasets
- Map datasets
- Declaring MapTable elements
- Import datasets
- Map datasets
- Dataset requirements
- Columns details
- Naming conventions
- Map
- Filters
- Options
- Table
- Options
- Export as SVG
- Credits
- Contribute
- Set up your development environment
- Todo
- Release History
Dependencies
- D3.js
- TopoJSON*: homepage or download (cdnjs)
- FileSaver.js*: homepage or download (cdnjs) - only used if you want to do client side SVG export
* Only used if you need a map
Install
Here is minimum amount of HTML to render a MapTable with Map, Filter and Table.
<script src="https://github.com/Packet-Clearing-House/maptable/raw/2.7.4/d3.min.js"></script>

<script src="https://github.com/Packet-Clearing-House/maptable/raw/2.7.4/topojson.min.js"></script>


<script src="https://github.com/Packet-Clearing-House/maptable/raw/2.7.4/maptable.min.js"></script>

<script>
  var viz = d3
    .maptable('#vizContainer')
    .csv('dataset.csv')
    .map({ path: 'world-110m.json' }) // You can remove this line if you want to disable the map
    .filters() // You can remove this line if you want to disable filters
    .table() // You can remove this line if you want to disable the table
    .render(); // This is important to render the visualization
</script>
MapTable is available on cdnjs.com. Remember though, cool kids concatenate their scripts to minimize http requests.
If you want to style the MapTable elements with some existing styles, you can prepend the above HTML with:
<link rel="stylesheet" href="https://maxcdn.bootstrapcdn.com/bootstrap/3.3.5/css/bootstrap.min.css" /> <link rel="stylesheet" href="https://github.com/Packet-Clearing-House/maptable/raw/2.7.4/maptable.css" />
Declaring MapTable elements
To create a visualization (Map or/and Table or/and Filters) of your dataset, you need to provide first the container of your visualization
The default order of the 3 components is Map, Filters and Table. If you want to place the components in a different order, you can put them on the main container:
You instantiate the MapTable library into the viz variable based on the #vizContainer ID you declared in the DOM:
<script>
  var viz = d3.maptable('#vizContainer'); // #vizContainer is the css selector that will contain your visualization
</script>
The MapTable viz declaration in the above example is a chain of functions. The possible functions that you can use are:
- viz.json(jsonPath[, preFilter]) with
jsonPathas string andpreFilteras function that filters the dataset upfront. - viz.jsonData(jsonData[, preFilter]) with
jsonDataas string andpreFilteras function that filters the dataset upfront. - viz.csv(csvPath[, preFilter]) with
csvPathas string andpreFilter. - viz.csvData(csvData[, preFilter]) with
csvDataas string andpreFilter. - viz.tsv(tsvPath[, preFilter]) with
tsvPathas string andpreFilter. - viz.tsvData(tsvData[, preFilter]) with
tsvDataas string andpreFilter. - viz.columns(columnDetails) with
columnDetailsas a JS dictionary. You can add/remove it of you want to customize your columns or create virtual columns based on the data. - viz.map(mapOptions) with
mapOptionsas a JS dictionary. You can add/remove it of you want a map on your visualization. - viz.filters(filtersOptions) with
filtersOptionsas a JS dictionary. You can add/remove it of you want filters on your visualization. - viz.table(tableOptions) with
tableOptionsas a JS dictionary. You can add/remove it of you want a table on your visualization. - viz.render([onComplete]) that closes the chain and renders the visualization. Don't forget this! It can take an optional callback function onComplete, that's executed when MapTable finishes rendering its components. For example if you have
function alertTest(){ alert('test!'); }you would call it withviz.render(alertTest).
Example with preFilter
var viz = d3
  .maptable('#vizContainer')
  .json('dir_data.json', (d) => parseInt(d.traffic) > 0)
  .map({ path: 'countries.json' })
  .render();
Import datasets
Datasets can be defined by using one of the these three sources:
# viz.json(url)
Import JSON file at the specified url with the mime type "application/json".
# viz.csv(url)
Import CSV file at the specified url with the mime type "text/csv".
# viz.tsv(url)
Import TSV file at the specified url with the mime type "text/tab-separated-values".
Map datasets
To plot lands and countries on the map, we're using TopoJSON library. The map can be generated through this tool: topojson-map-generator.
Dataset requirements
In order to plot your dataset on a map, there are minimum set of columns needed.
If you're planning to add markers on your map, you would need to provide latitude, longitude of your markers. You can also edit these keys name using the map options longitudeKey, latitudeKey.
[
  { "longitude": "13.23000", "latitude": "-8.85000" },
  { "longitude": "168.32000", "latitude": "-17.75000" }
]
If you're planing to add country related information, you should provide consistent country information on your dataset from the TopJSON file. You should provide at least one of these types on your mapOptions:
countryIdentifierKey:(string, default: 'country_code') Column name of country identifier (from the dataset). It goes as pair with the optioncountryIdentifierType.countryIdentifierType:(string, default: 'iso_a2') Country identifier type that we're using to attach data to countries on the map. The available types are:iso_a2(default): ISO_3166-1_alpha-2 country code formatiso_a3: ISO_3166-1_alpha-3 country code formatname: Country name that came from the GeoJSON map file.continent: Continent name that came from the GeoJSON map file.
For example for this dataset:
[
  { "country_code": "MAR", "Country Name": "Morocco", "bar": "foo" },
  { "country_code": "FRA", "Country Name": "France", "bar": "foo" }
]
You would use these options:
{
  countryIdentifierKey: 'country_code',
  countryIdentifierType: 'iso_a3'
}
or
{
  countryIdentifierKey: 'Country Name',
  countryIdentifierType: 'name'
}
Columns details
By default, MapTable imports all the columns and detects their format automatically. As well, you can customize behaviors of specific columns and create virtual columns.
# viz.columns(columnDetails) with columnDetails as a JS dictionary. You can add/remove it of you want to customize your columns or create virtual columns based on the data.
columnsDetails format
<PUT_YOUR_COLUMN_KEY>:(Object) Provide the columns key here to apply the options below to it. If this key is not defined in yoru dataset, then it will be dynamically added as virtual column:nowrap:(bool, default: false) When present, it specifies that the content inside a that column should not wrap.title:(string, default: columnKey) What we show as column name in filters and table.filterMethod:(string, default: 'field') Column format type, used for filtering. Available options:field: filter by keyworddropdown: exact match using a dropdowncompare: filter using comparison (≥, ≤, between ....)
virtual: (function(d), default: null) To create a new column that doesn't exists in the dataset, and we'd like to show it on the table or filters. You can also use it if you want to transform an existing column.cellContent: (function(d), default: null) Function that transforms an existing content using other rows. (for example to change the color depending on the data).dataParse:(function(d), default: null) Function that return the formatted data used to sort and compare cells.filterInputType:(string, default: 'text') HTML input type that we're using for the filters for that specific column (e.g. date, number, tel ...)
Example (adding nowrap and type to the region column key):
.columns({
  region: {
    nowrap: true,
    filterMethod: 'dropdown'
  }
})
Naming conventions
For the below examples, we define viz as the variable that loads MapTable.
Functions that have d as parameter, means that d is a JS dictionary that contains data for one row.
Functions that have groupedData as parameter, means that groupedData is a JS dictionary { key: 'groupedByKey', values: [ {d}, ... ] } that contains the key that have been used to group the data, and the matching values related to that grouping.
Map
#viz.map(mapOptions) with mapOptions as a JS dictionary. You can add/remove it of you want a map on your visualization.
Options
path:(string, required if pathData not set) URL of the TOPOJSON map, you can get them from Mike Bostock's repo: world atlas and us atlas. Or use this tool to generate these files as we did on the examples.pathData:(string, required if path not set) string containing the TOPOJSON maponComplete:(function, default: null) Callback function when the map first loaded.onRender:(function, default: null) Callback function when the map finished rendering.width:(integer, default:'window.innerWidth') Map Width.height:(integer, default:'window.innerHeight') Map Height.saveState:(bool, default: true) Save zoom state into the URLzoom:(bool, default: true) Enable zoom on the map (when scrolling up/down on the map).-
filterCountries:(function(country)) Filter countries follow a specific condition. Example:```js filterCountries: (country) => country.id !== 'AQ', // to remove Antarctica from the map ``` -
title:(object, default: see below) Add a title within the map. -
title.bgColor:(string, default: '#000000') Title font size. title.fontSize:(integer, default: 12) Title font size.title.fontFamily:(string, default: 'Helevetica, Arial, Sans-Serif') Title font family.title.content:_(function(countShown, countTotal, filtersDescript
Core symbols most depended-on inside this repo
getWidthShape
Languages
Modules by API surface
For agents
$ claude mcp add maptable \
  -- python -m otcore.mcp_server <graph>