github.com/OpenGeoscience/geojs @v1.19.1
Chat with this repoWhat it actually does AI analysis from the code graph — generated when you open this
README





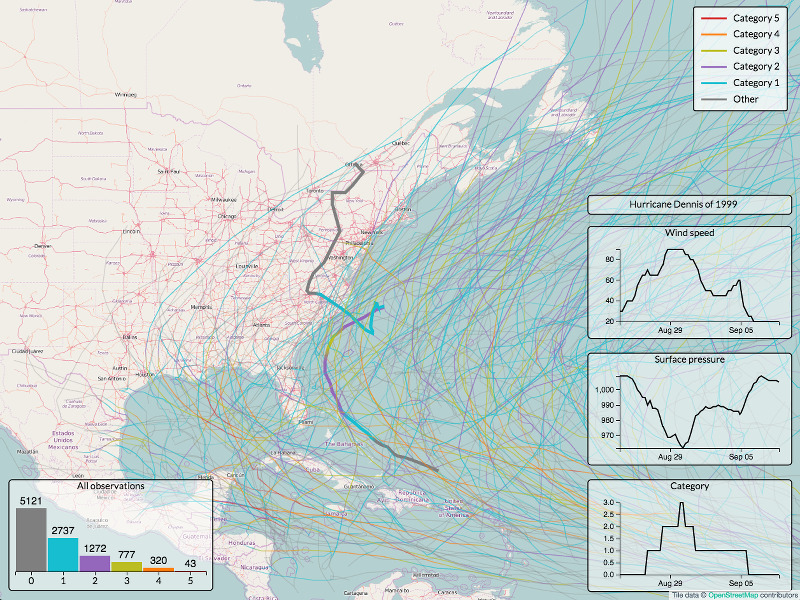
GeoJS is intended to bridge the gap between GIS, Scientific Visualization, and Infovis. GeoJS is more than just a GIS library as users can create scientific plots such as vector and contour and can embed infovis plots using D3.js. GeoJS aims for high-performance visualization and interactive data exploration of scientific and geospatial location aware datasets.
GeoJS supports features such as Point, Line, Polygon, and advanced features such as Pixelmap, Contour, Heatmap, and Choropleth.
GeoJS can read and render data from GeoJSON files, and WMS servers. Additional features includes Annotations, Legends, Animated Transitions, and Widgets.
GeoJS can also be used for visualizing medical imagery. See Digital Slide Archive for an example.
Examples
For live examples visit Github.io
Documentation
You can find more information on GeoJS installation and usage in our Documentation.
There are some additional resources:
- Quick-Start Guide
- Provisioning for Development
- Developer's Guide
- User's Guide
- Examples
- Tutorials
- API Documentation
Support
We would love to get your feedback and bug reports. Please use GitHub issues.
Get Involved
We are open for collaboration. Kitware has been doing open source development for the last 20 year and understands and appreciates what it takes to develop open source software.
Related Efforts
GeoJS has been used in various Girder based applications such as Dansfield-App and DIVE.
Core symbols most depended-on inside this repo
Shape
Languages
Modules by API surface
For agents
$ claude mcp add geojs \
  -- python -m otcore.mcp_server <graph>