github.com/Lramseyer/vaporview @1.5.4-release
Chat with this repoBrowse by type
What it actually does AI analysis from the code graph — generated when you open this
README
Vaporview
Vaporview is an open source waveform viewer extension for VScode.
VScode Marketplace | Open VSX | Github

Waveform Viewer Features
- Native support for VCD, FST, and GHW files
- Smooth panning and zooming using touchpad gestures or mouse scroll
- Signal customization, grouping, and reordering in the viewer
- Time markers - main and alt marker
- Color theme responsive waveform color palette
- Search for values within a waveform dump
- Search for variables and scopes in the netlist
- Custom signals from bit range
- Terminal Links for timestamps and instance paths
- Remote waveform viewing via VScode SSH and surfer surver
- IDE integration with other language extensions
Vaporview Also supports FSDB files where external libraries are present (see build FSDB addon). For use of other waveform dump formats such as LXT, VZT, GTKwave offers conversion tools. Proprietary formats such as WLF and VPD can also be converted, but require you to compile GTKwave. See the GTKwave Manual for details - page 16, and 69 for an overview.
VScode IDE Integration
Terminal Links
VaporView associates timestamps and netlist paths as links in the terminal. These links are activated by Ctrl + Clicking on the link. Timestamp links will place the marker at the designated timestamp and move the viewer to that marker (if necessary) whereas netlist path links will add the designated signal into the viewer. The following formats are recognized by VaporView:
- UVM timestamp - ie:
@ 50000 - Timestamp with Units - ie:
50,000 ns(comma is optional) - Netlist elements - ie:
top.submodule.signal
When clicking on instance path links, paths that point to a variable will add that variable to the viewer. However, if the path points to a scope, it will instead reveal and select that scope in the netlist view.
Interoperability With Other Extensions
List of extensions that connect to Vaporview:
- SV Pathfinder - RTL Linking and tracing - Github
- slang-server - System Verilog Language Server - Github
API details
Vaporview has a set of commands and event emitters that allow interaction with other extensions. This allows for powerful features like RTL linking, in editor debugging, and firmware tracing while being HDL and simulator agnostic. See the API docs if you are interested in integrating Vaporview into your extension.
Remote Waveform Viewing
Vaporview allows you to connect to a remote machine and open up waveforms remotely via VScode Remote Development or Surfer surver. Remote development should work out of the box, however to connect to a Surfer surver, you will need to enter in the command "> vaporview.openRemoteViewer" and paste in the URL for the Surfer surver. Alternatively, if the URL is in a VScode terminal, it can be connected to automatically by clicking on the link.
Controls
Keyboard Shortcuts
- Ctrl + Scroll Wheel - Zoom in and out on waveforms
- Ctrl + 0 - Zoom out to fit
- Shift + Scroll Wheel - Scroll up and down on waveforms
- Up/Down Arrow - Select signal above/below selected signal
- Alt + Up/Down Arrow - Rearrange selected signal
- Ctrl/Cmd + A - Select all signals
- Left/Right Arrow - Move marker to previous/next value change of selected signal
- Alt + Left/Right Arrow - Move Alt-marker to previous/next value change of selected signal
- Alt + Click or Middle Click - Set Alt-marker
- Home and End - Scroll to the beginning and end (respectively) of the waveform
- Delete or Backspace - Remove Selected Signal
- Ctrl/Cmd + Z or Ctrl/Cmd + Shift + Z - Undo or Redo action
- Ctrl/Cmd + F - Search netlist
- F2 - Rename selected item
- G - Create new group from selected items
- 1 through 8 - Change selected signal color
- Escape - Abort click and drag event (Rearranging signals, zoom, scrolling)
Adding and Removing Signals
Signals may be added or removed through Vaporview netlist view. Click on the VaporView Activity Bar icon, and it will show the netlist for the opened waveform file.
Adding Signals

To Add a signal, double click on it in the netlist view or click the "+" icon on the right.
Signals can also be added by dragging and dropping them from the netlist view to the viewer. Make sure to hold Shift before dropping them into the viewer (this is unfortunately a VScode requirement.)
Removing Signals
To remove a signal, you can either select the signal or set of signals you would like to remove and hit Delete or Backspace. You can also right click on a signal in the viewer and select remove signal from the menu.
Other less common ways
Multiple signals can be added or removed by selecting the signals you would like to add or remove, and then right click and select Add/Remove selected signals from the menu.
Signals can be added via a terminal link, and they can be added or removed via API commands.
Scrolling
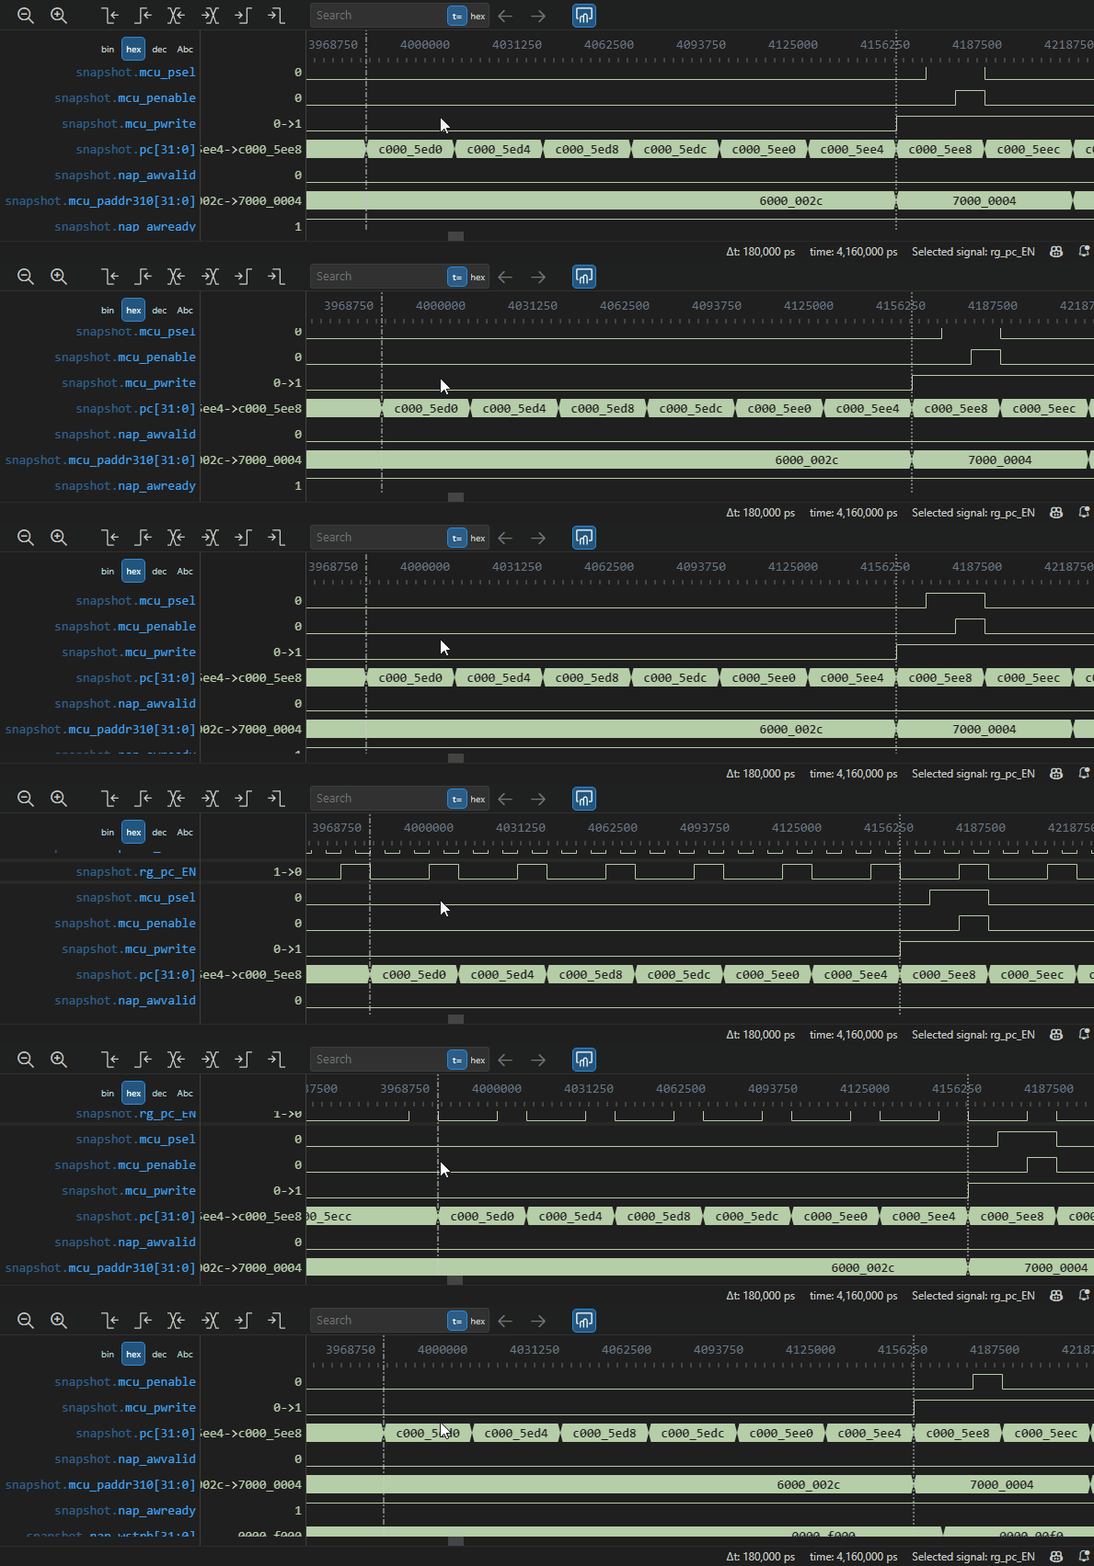
The scroll wheel (or touchpad scroll) is used to pan in time or scroll up or down. By default, auto detect scrolling mode is enabled. To toggle between scrolling modes, click the "Auto detect Mouse/Touchpad Scrolling", "Enable Touchpad Scrolling", or "Enable Mouse Scrolling" Button on the top right.
Mouse Scrolling
Scroll wheel scrolls sideways by default. To scroll up or down, either hold Shift and scroll, or hover the cursor over to the signal name labels on the left and scroll normally.
Touchpad Scrolling
Zooming
Zooming can be done one of 3 ways:
- Hold Ctrl, and Scroll, or use the pinch gesture in touchpad mode
- Use the Zoom in/out buttons on the top right
- Click and drag over the area you wish to zoom in on
- Note that zoom animations can be disabled in the settings

Rearranging signals

To rearrange signals, simply click on the label and drag the signal to where you want it.
Alternatively, you can select a signal, hold Alt, and press the Up or Down Arrows to reorder (similar to how you reorder lines in the text editor)
Marker Handling

There are two markers in VaporView: a normal marker, and an alt-marker. To place the marker, simply click where you want it to be placed. Keep in mind that it will snap to edge if applicable. To place the alt-marker, either Middle Click, or Alt + Click where you would like to place it. The alt-marker will also snap to an edge if applicable.
It should also be noted that signals can be selected by clicking on them, You can also use the Up/Down Arrow keys to move the selection.
Next/Previous Edge
To move the marker to the nearest edge of the selected signal, you can either click the control bar buttons, or use the Left/Right Arrow Keys. Alternatively, VaporView also supports the Verdi bindings of using "N" and "Shift + N" to go to the next and previous edge respectively. If no signals are selected, the marker will step forward or backward 1 time unit.
To move to the next positive edge or negative edge, you will have to use the control bar buttons. This only applies to single bit waveforms.
Placing markers as links from log files
When log files are opened in the terminal, VaporView will automatically parse out timestamps. Use Ctrl + Click to place a marker and move to that timestamp. Note that if multiple viewers are open, it will place a marker in the last active viewer.
Finding values and transitions in a particular waveform
Finding a particular transition or a value in a waveform is done in relation to the selected signal and the marker (similar to how Visual Studio Code handles search in relation to the text cursor)
Value Formatting
Vaporview can display values in different number formats. To change the value format, right click on the signal in the viewer and select Format Values -> and select the value format you wish to display. Note that some values have limitations when displaying values with non-2-state bits in them, and will fall back to displaying the value as Binary. For details see the table below:
| Value Format | Non-2-state Supported | Justify Direction |
|---|---|---|
| Binary | ✅ Yes | Right |
| Hexadecimal | ✅ Yes | Right |
| Octal | ✅ Yes | Right |
| Decimal | ❌ No | Left |
| Fixed Point | ❌ No | Left |
| Floating Point | ❌ No | Left |
| ASCII | ❌ No | Left |
| Epoch Time (ns) | ❌ No | Left |
| Enum | ❌ No | Left |
Waveform Color
Vaporview supports 8 different waveform colors. The colors are based off the semantic token colors for VScode text as defined by the color theme. Colors are selected based on background contrast and uniqueness. To change the color, right click on the waveform, select Color -> and select the color you wish to use. Alternatively you can use the number keys 1 through 8 to change the color of the selected signal.

Waveform Render Types
Aside from the binary and multi-bit waveform renderers, Vaporview supports displaying analog signals. Any multi-bit variable or Real type supports this. Analog signals can be displayed wither as a linear or stepped line. In the case of binary values, the Y value can be evaluated as either a signed or unsigned value. To change the Render Type, right click on the signal in the viewer and select Render Type -> and select the render type you wish to use for the signal.
Multi-bit display type
The multi-bit renderer defaults to shaded shapes, but the more traditional outlined shapes can be enabled in the settings by de-selecting "Fill Multi Bit Values" ("vaporview.fillMultiBitValues": false)
Analog Waveforms
Vaporview supports analog waveforms for Real and Bit Vector data types. For Bit Vector data types, waveforms can be interpreted as signed or unsigned values. Analog waveforms support different row heights as well as vertical zooming.
To adjust the row height, right click on the signal, and select your desired row height. To vertically zoom, select the signal and press Alt +/- to vertically zoom
Custom Signals
Vaporview allows users to create custom signals from a subset of bits from a multi-bit signal. To create a custom signal, right click on a multi-bit variable, and select New Signal From Bit Range... This will prompt the user in the command bar for a bit range. This allows for single bit or multi bit inputs, and will create a new custom signal that can be moved and displayed independently of the original signal.
Alternatively, signals can be automatically split into all individual bits, nibbles, bytes, words, etc. To do this, right click on the multi-bit variable, go to Create Signals From, and select bit width. This will create a group with all of the bits split (starting from bit 0.)
Time Units
You can change the Time Units in one of 2 ways: clicking the Time Status Bar in the lower right hand corner of the window, or by right clicking on the time ruler and selecting units from the Time Unit menu.
Saving and loading opened signals
VaporView allows you to save and load your signal list. This can be done either by right clicking anywhere in the viewer or netlist and selecting "Save Vaporview Settings" or "Load Vaporview Settings". You can also save settings by pressing Ctrl + S. Saved user settings are tracked like a text document in VScode. So once you specify a file (by either saving or loading a file) VScode will track changes and automatically update the file when pressing Ctrl + S. If you make changes and close without saving, it will prompt you about unsaved changes.
Copying selection as WaveDrom
If you would like to export a portion of the viewer as WaveDrom, VaporView supports that ...with some limitations. Since WaveDrom is a simplified format for making waveform diagrams, not all of the precise timing detail can be captured in WaveDrom.
A maximum of 32 events can be copied as WaveDrom. To select a copy range, simply place the marker and alt-marker at the start and end of your selection range (ordering doesn't matter) Right click on the waveforms, and select "Copy Selection as WaveDrom" from the menu. The WaveDrom JSON text will th
Extension points exported contracts — how you extend this code
browse all types & interfaces →
Core symbols most depended-on inside this repo
Shape
Languages
Modules by API surface
For agents
$ claude mcp add vaporview \
  -- python -m otcore.mcp_server <graph>