github.com/KiranGershenfeld/VisualizingTwitchCommunities @main
Chat with this repoBrowse by type
What it actually does AI analysis from the code graph — generated when you open this
README
VisualizingTwitchCommunities
This project maps communities of streamers on Twitch.tv based on shared viewership. The data is collected from the Twitch API and visualized in Gephi.
Results
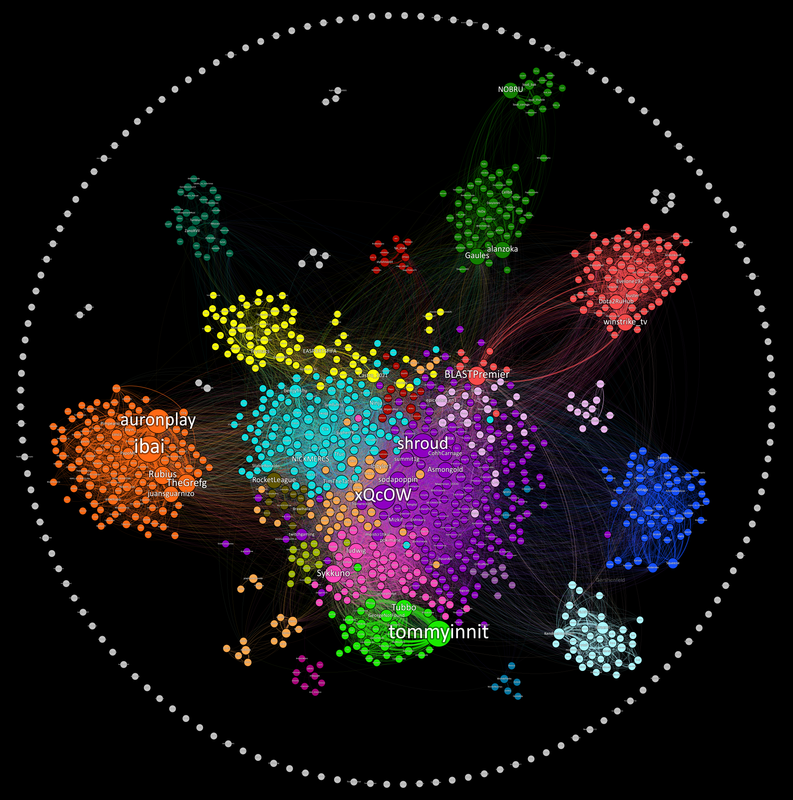
I wrote an article on TowardsDataScience here
If your curious about how to read this graph and why I made it, check out the article.
How can I mess with the graph?
I made the graph in a free data visualization tool called Gephi. Download it here The data set is in Visulization/GephiData . In gephi go to laboratory and import the edge file as an edgelist. Then import the label file as a node list. From there you can go to overview and run a modularity analysis on the nodes to detect communities.
How can I collect more data?
The DataCollection folder has a script called main that can be ran to collect the top 100 streams and all their viewers and save it to a csv. You can use the windows task scheduler to run this task at any time interval you like and build up data over long periods of time.
Core symbols most depended-on inside this repo
Shape
Languages
Modules by API surface
For agents
$ claude mcp add VisualizingTwitchCommunities \
  -- python -m otcore.mcp_server <graph>