github.com/JoelOtter/kajero @main sqlite
README
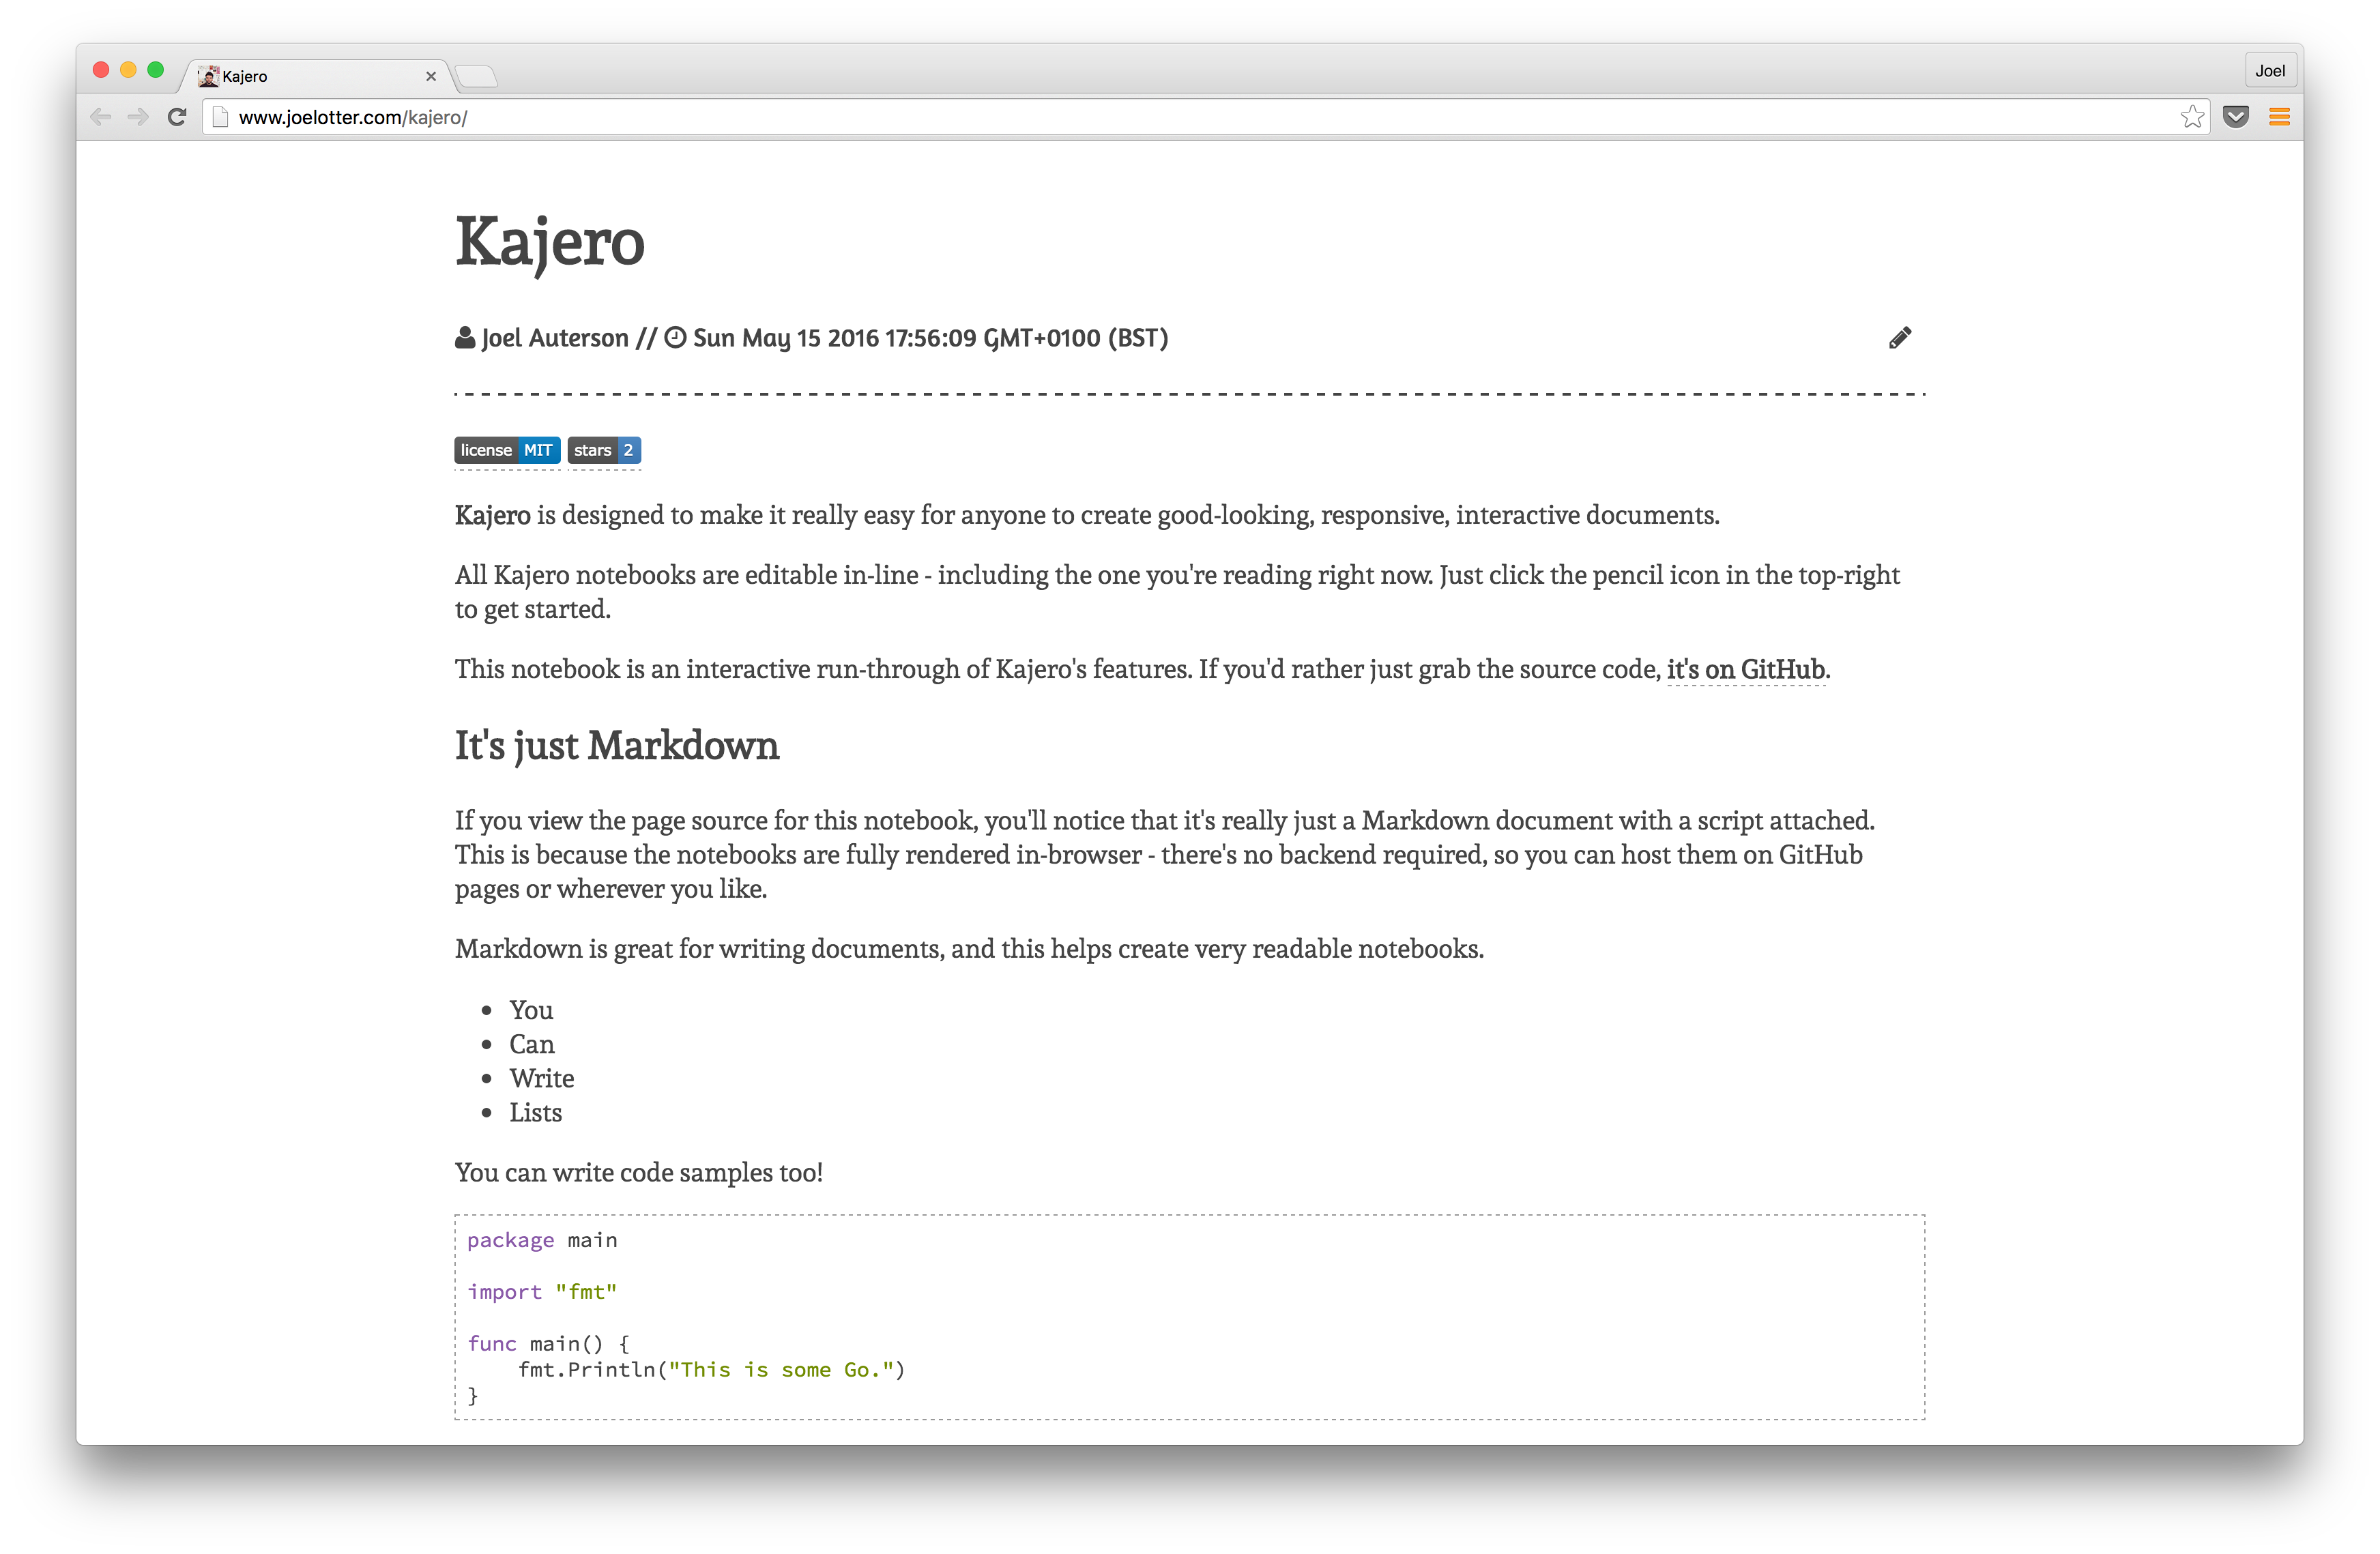
Kajero


Interactive JavaScript notebooks with clever graphing.
You can view a sample notebook here.
Features
- It's just Markdown - a Kajero notebook is just a Markdown document with a script attached.
- Every notebook is fully editable in the browser, and can be saved as Markdown or HTML.
- Notebooks can also be published as Gists, generating a unique URL for your notebook.
- JavaScript code blocks can be executed. They're treated as functions, with their return value visualised. Kajero can visualise arrays and objects, similar to the Chrome object inspector.
- Code blocks can be set to run automatically when the notebook loads. They can also be set to hidden, so that only the result is visible.
- Data sources can be defined. These will be automatically fetched when the notebook is loaded, and made available for use inside code blocks.
- Includes Reshaper, for automatic reshaping of structured data.
- Includes D3, NVD3 and Jutsu, a very simple graphing library which uses Reshaper to transform arbitrary data into a form that can be graphed.
Related projects
- Reshaper - reshape data to match a schema
- Smolder - a library wrapper that attempts to reshape data going into your functions, using Reshaper
- Jutsu - a simple graphing library, with support for Smolder
Contributing
Issues and Pull Requests are both extremely welcome!
Command-line tools
Kajero includes a couple of simple command-line tools for users who don't want to use the inline editor to create their notebooks.
Installation
npm install -g kajero, or clone this repository.
You can build the JS library by running npm install, followed by gulp. For a production build, NODE_ENV=production gulp.
Commands
You can generate new notebooks directly from Markdown files without using the web editor.
kajero html [file.md]
Will output generated HTML of a new notebook. You can pipe it to a file like this:
kajero html [file.md] > output.html
kajero publish [file.md]
Will publish your notebook as a gist, and return a unique URL to your new notebook. You don't need to build the JS library for these scripts to work.
Running tests
Run the unit tests with npm test.
For coverage reporting, run with npm run test-cov. Note that the coverage percentages may not be exactly correct - this is because Istanbul runs over the compiled ES5 code, rather than the ES6 source.
Core symbols most depended-on inside this repo
handleFirstChangeShape
Languages
Modules by API surface
Dependencies from manifests, versioned
For agents
$ claude mcp add kajero \
  -- python -m otcore.mcp_server <graph>