github.com/JoaoLopesF/RemoteDebug @v3.0.5
Chat with this repoBrowse by type
What it actually does AI analysis from the code graph — generated when you open this
README
RemoteDebug Library
A library for Arduino to debug projects over WiFi, with web app or telnet client, with Print commands like Serial Monitor.








A library to remotely debug over a WiFi connection by telnet or web browser
RemoteDebug setup a TCP/IP server, that you connect to debugging, as an alternative to the serial connection
Contents
- About
- How it looks
- Github
- News
- Benefits
- HTML5 web app
- Telnet client
- Wishlist
- Install
- Using
- Known issues
- Releases
- Thanks
About
By default the Arduino only has as debug possibility via the Serial port. This has a few disadvantages:
- requires a physical cable to the Arduino device (if the device is far away or in a remote location this is not easy)
- debugging multiple Arduinos at the same time requires many serial ports and a lot of cables
With the ESP8266 (NodeMCU) or ESP32 we now have network connectivity (WiFi) which can be used for streaming debugging information in real-time.
This library is good for IoT projects, home automation, mobile robots (can debug it in moviment with a cable ?) or another WiFi projects.
In fact, this library was born of a need to debug an IoT project of home automation. In this project there was a central module and three auxiliary modules, and these were far from each other. One was hard to reach, under the roof of the house. To debug this project, accompanying the exchange of messages in realtime, is impossible to do with traditional way, by USB cable.
The MiP_ESP8266_Library and my ESP32 WiFi robot are example of projects that uses RemoteDebug. See it in: MiP_ESP8266_Library and ESPlorer_v1
RemoteDebug is improved with client buffering (is last send is <= 10ms), to avoid mysterious delays of WiFi networking on ESP32 and ESP8266 boards
Note: If your project not use WiFi, you can use my another library, the SerialDebug library, this library works with any Arduino board.
Note II: RemoteDebug library is now only to Espressif boards, as ESP32 and ESP8266, If need for another WiFi boards, please add an issue about this and we will see if it is possible made the port for your board.
How it looks
Image: In RemoteDebugApp (web app)

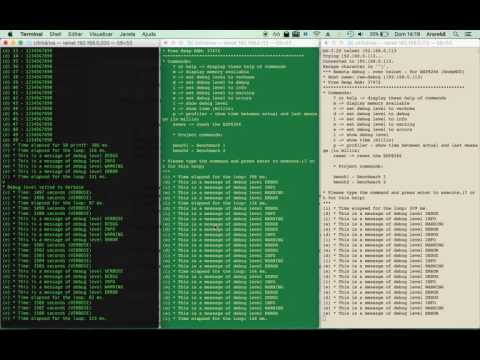
Image: In telnet client

Youtube (RemoteDebug v2):

Youtube (3 telnet connections with RemoteDebug) v1:
Github
Contribute to this library development by creating an account on GitHub.
Please give a star, if you find this library useful, this help an another people, discover it too.
Please add an issue for problems or suggestion.
News
-
RemoteDebugApp Beta
-
Now have another repository, RemoteDebugApp It is for local copy of web app in internet. It is updated with lastest version of web app, after it is publised in web server: http://joaolopesf.net/remotedebugapp. Download it, for use when internet is offline. As it is a local copy, the app will check for new versions periodically.
-
An HTML5 web app to use for debugging in web browser, instead telnet client, that uses web socket to comunicate.
-
Now RemoteDebug v3 have a web socket server too, to support the RemoteDebugApp connection.
-
RemoteDebugApp is in beta, if you have any problems or suggestions, please add issue about this.
-
The telnet connection remains, to any want this, or to internet offline uses.
-
Version 2.1.1
-
Now RemoteDebug have a code converter, for help you to convert your codes: to do it, please access the RemoteDebugConverter
-
Version 2.0.0
-
Now RemoteDebug can have the same simple software debugger, that SerialDebug library have. This is done, installing another library, the RemoteDebugger The RemoteDebugger act as an add on to RemoteDebug. To support this addon, the changes in RemoteDebug, is minimum, just a few callbacks It is done to no add extra overhead to projects that no need an debugger. To more informations please access the RemoteDebugger github repository.
-
Now RemoteDebug have a new color system, using more colors, as done in SerialDebugApp
Note: due the RemoteDebug library, is migrate to Arduino 1.5 format, with folder "src", please delete and reinstall the library to avoid duplication of RemoteDebug sources files.
-
Version 1.5.*
In 1.5.0 version, we have debug and rdebug macros (see below), that put automatically, the name of function that called, and core id (core id is only for ESP32)
Benefits
SerialDebug is better than Arduino default debugging by Serial.print commands:
This is more optimized
Being or not debugging via USB cable, the Serial.print command allways is processed, waste CPU time on microcontroller. In other words, the debug commands are processed, with someone connected in the serial or not.
With RemoteDebug, all debug output is processed only if exists anyone debugging via telnet or web app connection.
And with the debug levels of resource, the volume displayed of messages are reduced for higher levels. For example, only process all messages, if the level is the lowest, the verbose,
RemoteDebug is otimized to reduce overheads, in CPU and memory and include client buffering feature.
Have debug levels
During the development, we can put a lot of debug messages...
But with RemoteDebug, we can put a level in each one.
For all messages (except levels always (debugA) or error (debugE), the message only is processed and showed, if debug level is equal or higher than it level
RemoteDebug have 6 debug levels, in order of priority:
Alway showed:
Error: Critical errors
Always: Important messages
Another levels (showed if level is equal or higher that actual one):
Warning: Error conditions but not critical
Info: Information messages
Debug: Extra information
Verbose: More information than the usual
So We can change the level to verbose, to see all messages. Or to debug to see only debug or higher level, etc.
Is very good to reduce a quantity of messages that a project can generate, to help debugging.
It is easy to migrate
RemoteDebug have a converter to help migrate your Arduino codes, from Serial.prints to this library.
Even if you want to do this manually, it's very simple. Please see topic Using above.
Have auto function name and simple profiler
A simple debug:
```cpp debugV("* Run time: %02u:%02u:%02u (VERBOSE)", mRunHours, mRunMinutes, mRunSeconds); ````
Can generate this output in serial monitor:
    (V p:3065 loop C1) * Run time: 00:41:23 (VERBOSE)

    Where:  V: is the level
            p: is a profiler time, elased, between this and previous debug
            loop: is a function name, that executed this debug
            C1: is a core that executed this debug (and a function of this) (only for ESP32)
            The remaining is the message formatted (printf)
For ESP32, the core id in each debug is very good to optimizer multicore programming.
Have commands to execute from telnet or web app
For example:
- Show help (?)
- Change the level of debug (v,d,i,w,e), to show less or more messages.
- See memory (m)
- Reset the board (reset)
See about RemoteDebug commands below.
You can add your own commands, see the examples please
If your project have RemoteDebugger installed, have a new commands, e.g. call a function, see/change variables, ...
Have a simple software debugger
Now RemoteDebug (version >= 2.0.0), have an simple software debuggger, based in codes of SerialDebug library.
This is another library, that act as an addon to RemoteDebug.
Please acess the RemoteDebugger repository to more informations: RemoteDebugger
Ready for production (release compiler)
For release your device, just uncomment DEBUG_DISABLED in your project
Done this, and no more debug processing.
And better for DEBUG_DISABLED, __RemoteDebug__ have ZERO overhead,
due is nothing of this is compiled.
Web app
As SerialDebug, now RemoteDebug (v3) have an app,the RemoteDebugApp, to debug in web browser.
This app is an HTM5 web app, with websocket to comunicate to Arduino board.
For it, RemoteDebug v3 have a web socket server (can be disabled).
It used a local copy of arduinoWebSockets library,
due it not in Arduino Library manager.
As a large web page on web server, the solution for Arduino is save it in a storage, like SPIFFS. But not have automatically updates new version in data saved this way, this SPIFFS data is good for a project but not for a library.
Due it, this app not is stored and served by board, instead the app is in web: http://joaolopesf.net/remotedebugapp Note: this not uses SSL (https), due web server socket on Arduino, not supports SSL (wss). But after page load, all traffic is in local network, no data is exposed on internet.
The RemoteDebugApp is a modern HTML5 and needs a modern browsers to work. Internet Explorer 11 and Safari 10 are an examples that not supported. But you can use anothers, as Chrome, Edge, Firefox.
The web app is in beta, please add an issue, for problems or suggestions.
Now have another repository, RemoteDebugApp It is for local copy of web app in internet. It is updated with lastest version of web app, after it is publised in web server: http://joaolopesf.net/remotedebugapp. Download it, for use when internet is offline. As it is a local copy, the app will check for new versions periodically, for you can download a new version.
The telnet remains work, for when want this, or for fails on web app.
Telnet
Telnet is a standard way of remotely connecting to a server and is supported on all operating systems (Windows, Mac, Linux...).
MacOSx and Linux have a native telnet client.
For Windows, a typical telnet client is the Putty: putty .
Have a good tool for mobiles: the Fing, please find it in your mobile store. Its show all devices in local network (WiFi), show ports opened and can execute the telnet client too (external App)
RemoteDebug sets-up a telnet server which is listening to any telnet client that wants to connect. After connection, logging is streamed to the telnet client.
RemoteDebug is very simple to use, after a few lines of initialization code, you can use the well-known "print" commands to stream your logging to the remote client.
Debug levels
RemoteDebug supports the filtering of logging based on debug levels:
Only show for it actual debug level:
- Verbose
- Debug
- Info
- Warnings
Note: These levels are in the order of most-logging -> least-logging.
Or for always show (not depends of actual debug level):
- Any
- Errors
Note: All debugs is processed and showed only if have a client connection.
The telnet client or web app can set the debug level by typing a few simple commands.
Profiler
RemoteDebug includes a simple profiler. It can be enabled by the connected client (telnet or web app) or the Arduino code itself.
When enabled, it shows the time between 2 debug statements, using different colors depending on the elapsed time.
A typical example would be to insert logging just before and after a function after which you can see how much the is spe
Core symbols most depended-on inside this repo
Shape
Languages
Modules by API surface
For agents
$ claude mcp add RemoteDebug \
  -- python -m otcore.mcp_server <graph>