github.com/Image-Py/imagepy @v0.2
Chat with this repoWhat it actually does AI analysis from the code graph — generated when you open this
README
Introduction
ImagePy is an open source image processing framework written in Python. Its UI interface, image data structure and table data structure are wxpython-based, Numpy-based and pandas-based respectively. Furthermore, it supports any plug-in based on Numpy and pandas, which can talk easily between scipy.ndimage, scikit-image, simpleitk, opencv and other image processing libraries.
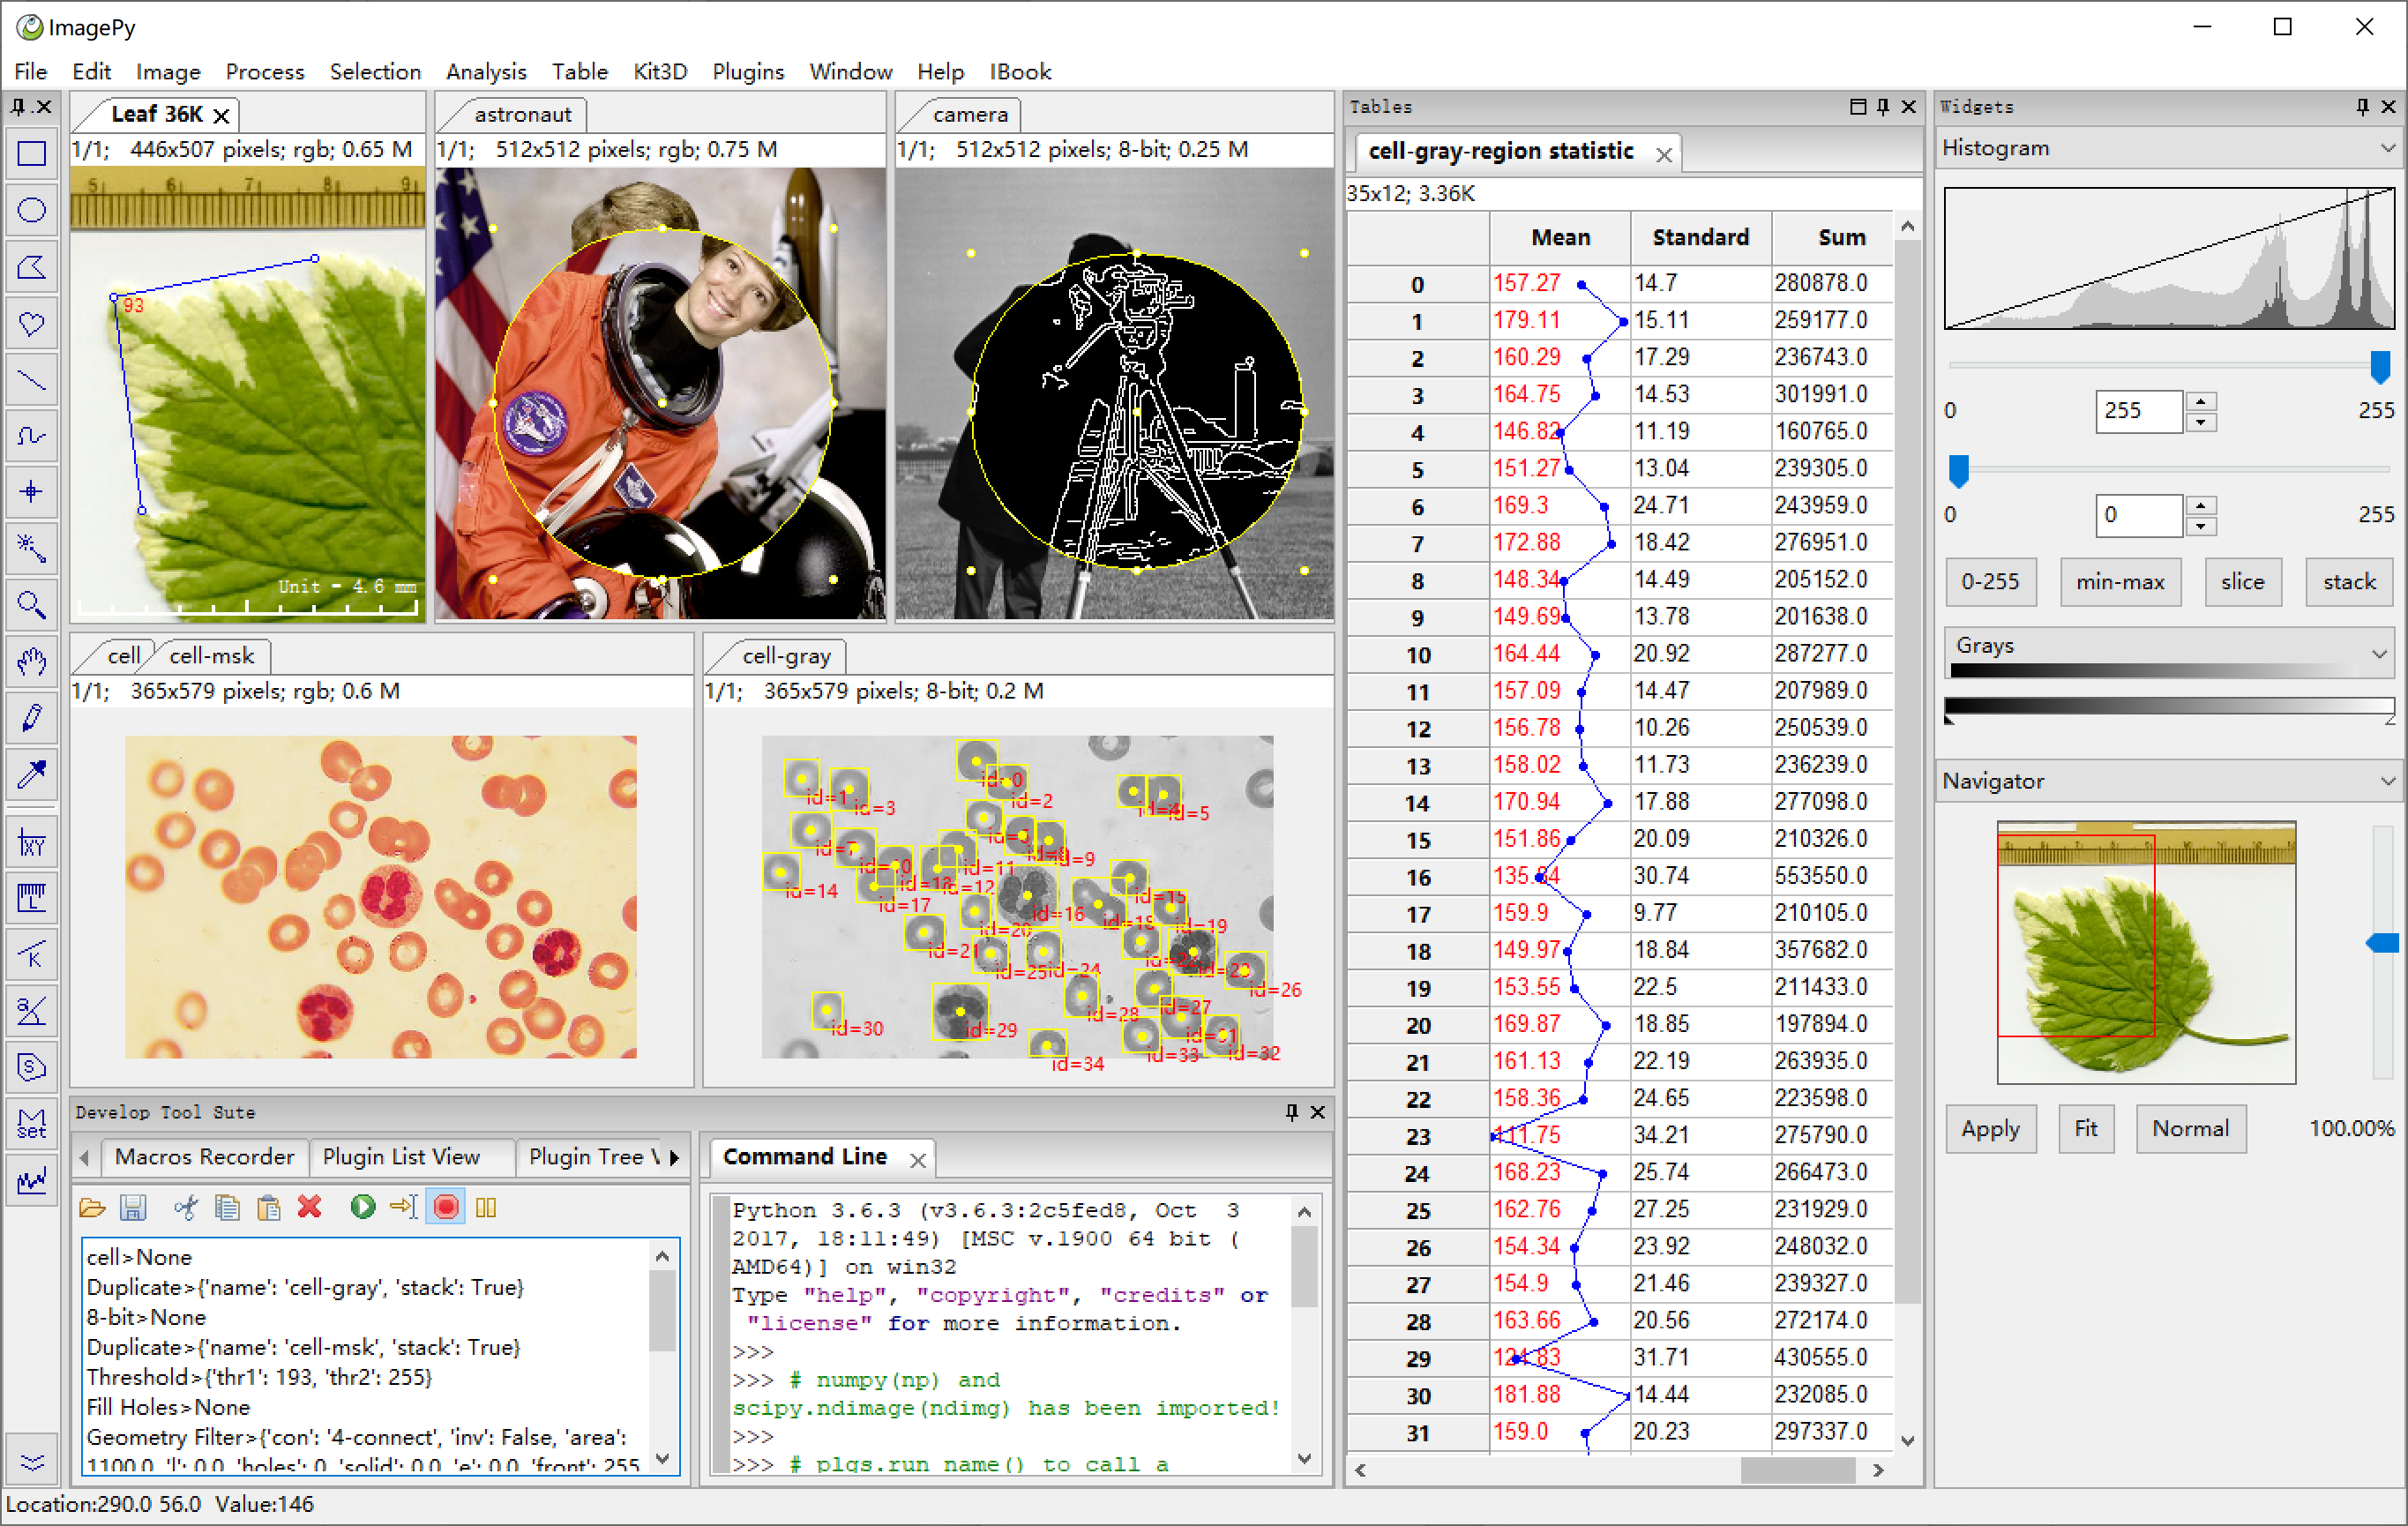
Overview, mouse measurement, geometric transformation, filtering, segmentation, counting, etc.

If you are more a IJ-style user, try Windows -> Windows Style to switch
ImagePy: - has a user-friendly interface - can read/save a variety of image data formats - supports ROI settings, drawing, measurement and other mouse operations - can perform image filtering, morphological operations and other routine operations - can do image segmentation, area counting, geometric measurement and density analysis. - is able to perform data analysis, filtering, statistical analysis and others related to the parameters extracted from the image.
Our long-term goal of this project is to be used as ImageJ + SPSS (although not achieved yet)
Installation
OS support:windows, linux, mac, with python3.x
- ImagePy is a ui framework based on wxpython, which can not be installed with pip on Linux. You need download the whl according to your Linux system.
- On Linux and Mac, there may be permission denied promblem, for ImagePy will write some config information, so please start with sudo. If you install with pip, please add --user parameter like this: pip install --user imagepy
- If you install ImagePy in an Anaconda virtual environment, you may get a error when starting like this: This program needs access to the screen. Please run with a Framework build of python, and only when you are logged in on the main display, if so, please start with pythonw -m imagepy.
Citation:
Forum
ImagePy is a community partner of forum.image.sc, Anything about the usage and development of ImagePy could be discussed in https://forum.image.sc.
Contribute
Contribute Manual: All markdown file under doc folder be parsed as manual. Plugins and manual are paired by plugins's title and manual's file name. We can browse document from the parameter dialog's Help button. We need more manual contributors, just pull request markdown file here.
Contribute Plugins: Here is a demo plugin repositories with document to show how to write plugins and publish on ImagePy. You are wellcom and feel free to contact with us if you need help.
Improve Main Framework: Just fork ImagePy, then give Pull Request. But if you want to add some new feature, Please have a issue with us firstly.
Basic operations:
ImagePy has a very rich set of features, and here, we use a specific example to show you a glimpse of the capacity of ImagePy. We choose the official coin split of scikit-image, since this example is simple and comprehensive.
Open image
menu: File -> Local Samples -> Coins to open the sample image within ImagePy.
PS: ImagePy supports bmp, jpg, png, gif, tif and other commonly used file formats. By installing ITK plug-in,dicom,nii and other medical image formats can also be read/saved. It is also possible to read/write wmv, avi and other video formats by installing OpenCV.
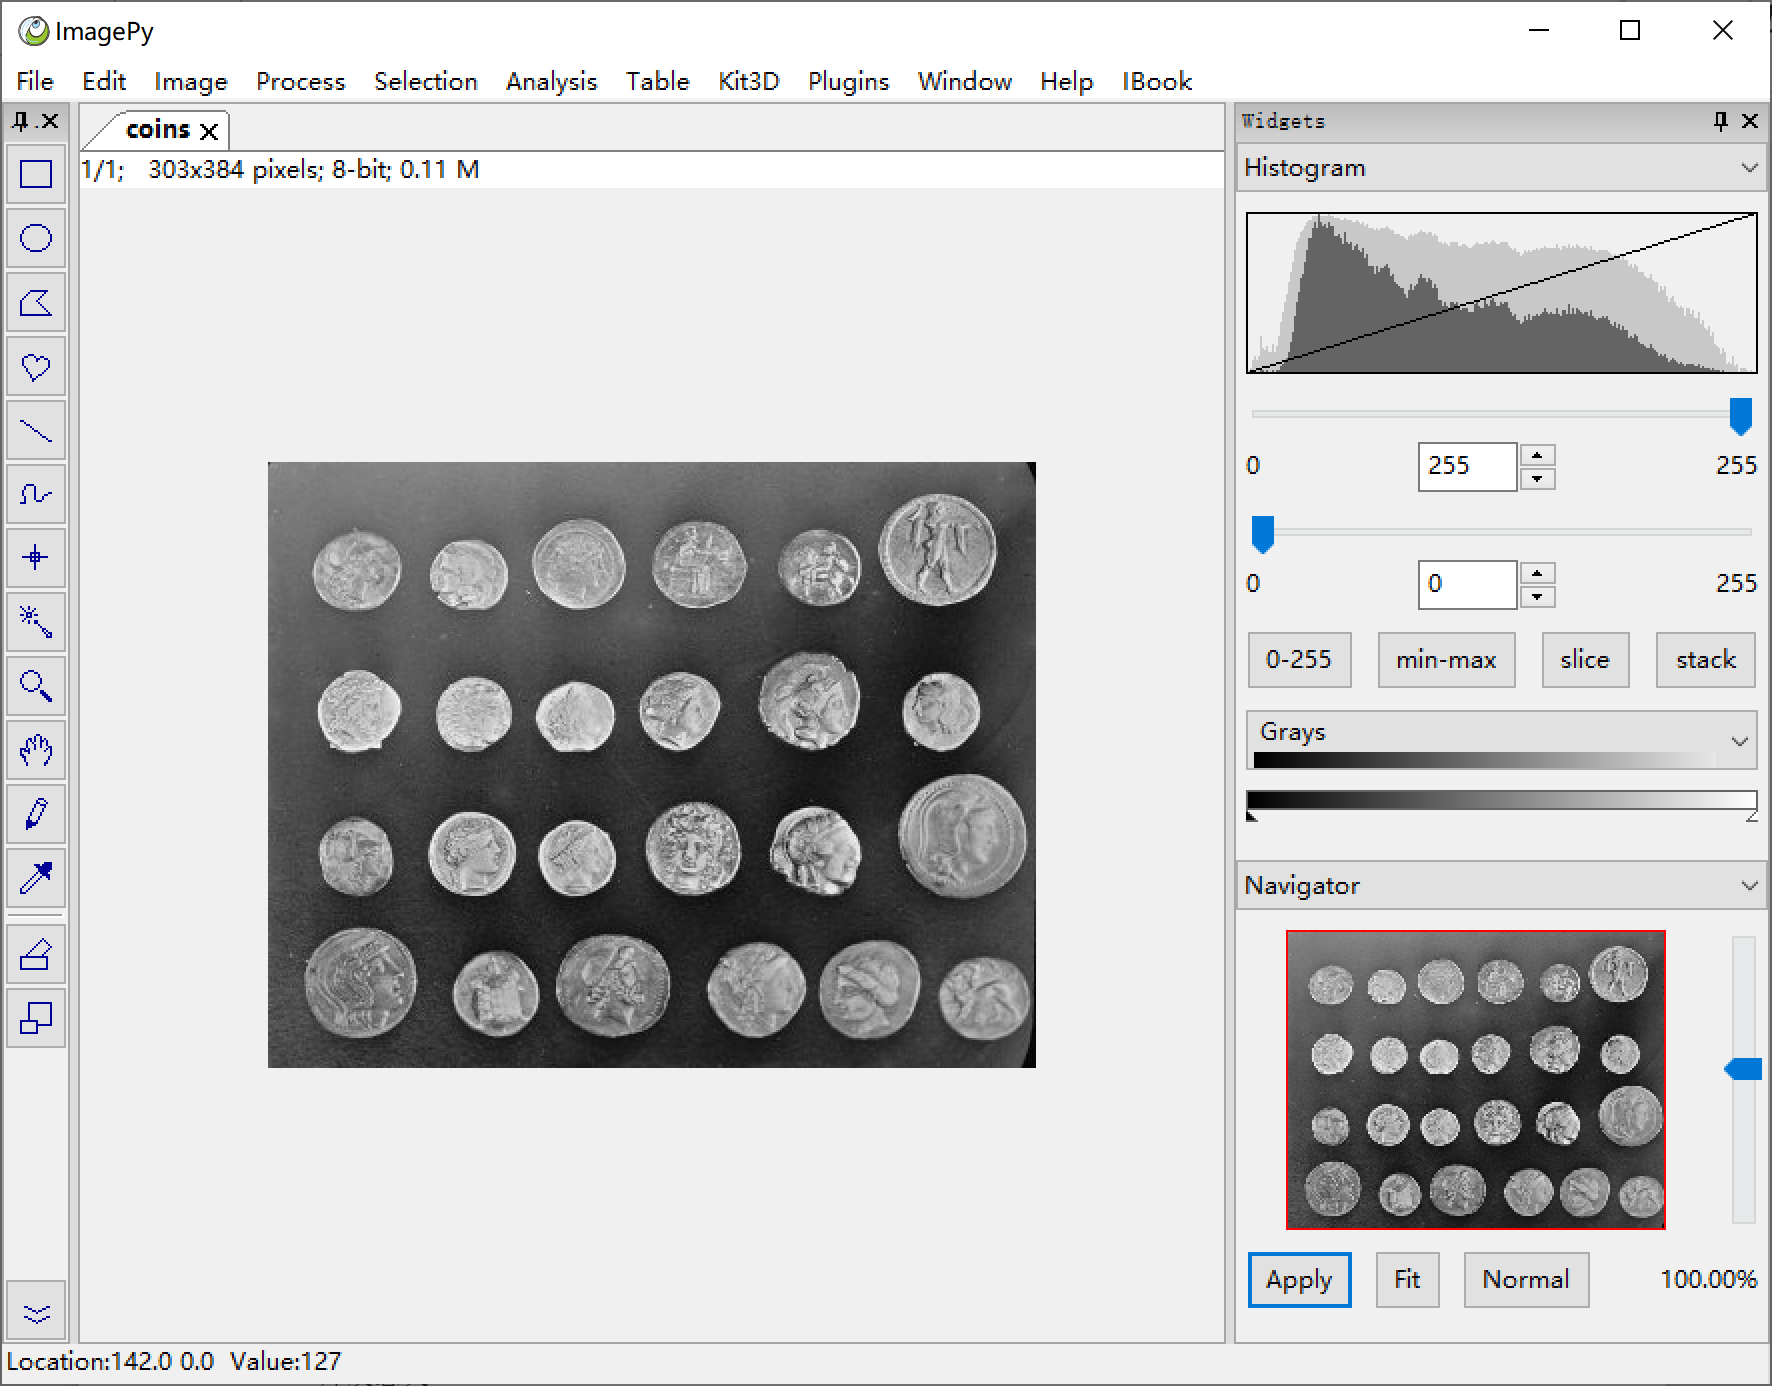
Coins
Filtering & Segmentation
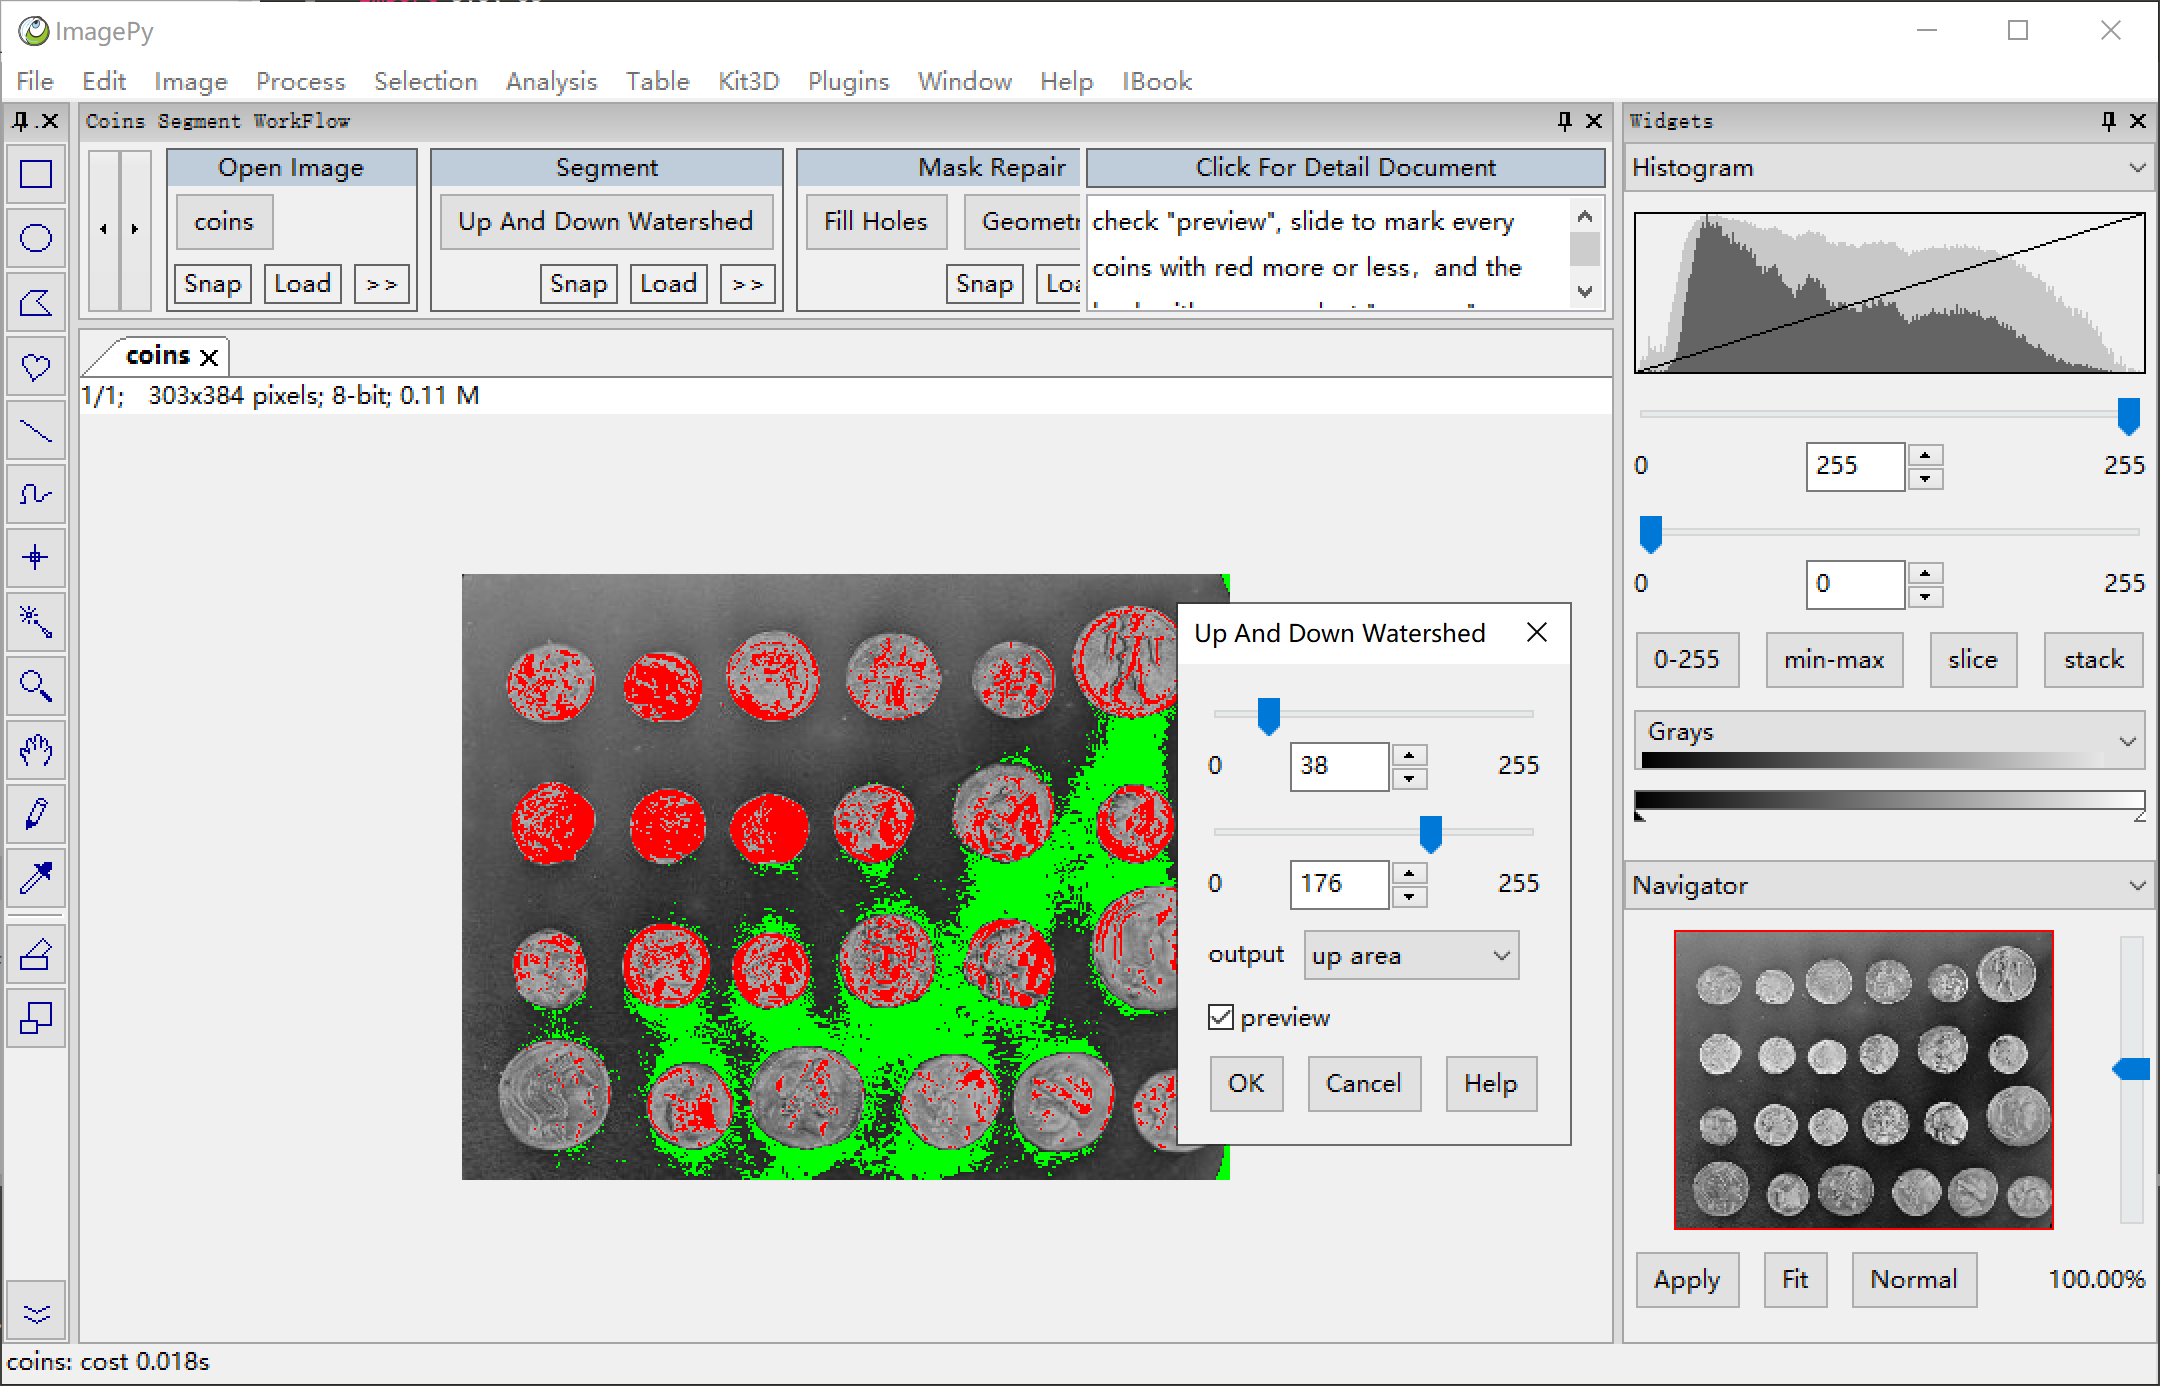
menu:Process -> Hydrology -> Up And Down Watershed Here, a composite filter is selected to perform sobel gradient extraction on the image, and then the upper and lower thresholds are used as the mark, and finally we watershed on the gradient map.
Filtering and segmentation are the crucial skills in the image processing toolkit, and are the key to the success or failure of the final measurement.
Segmentation methods such as adaptive thresholds, watersheds and others are also supported.
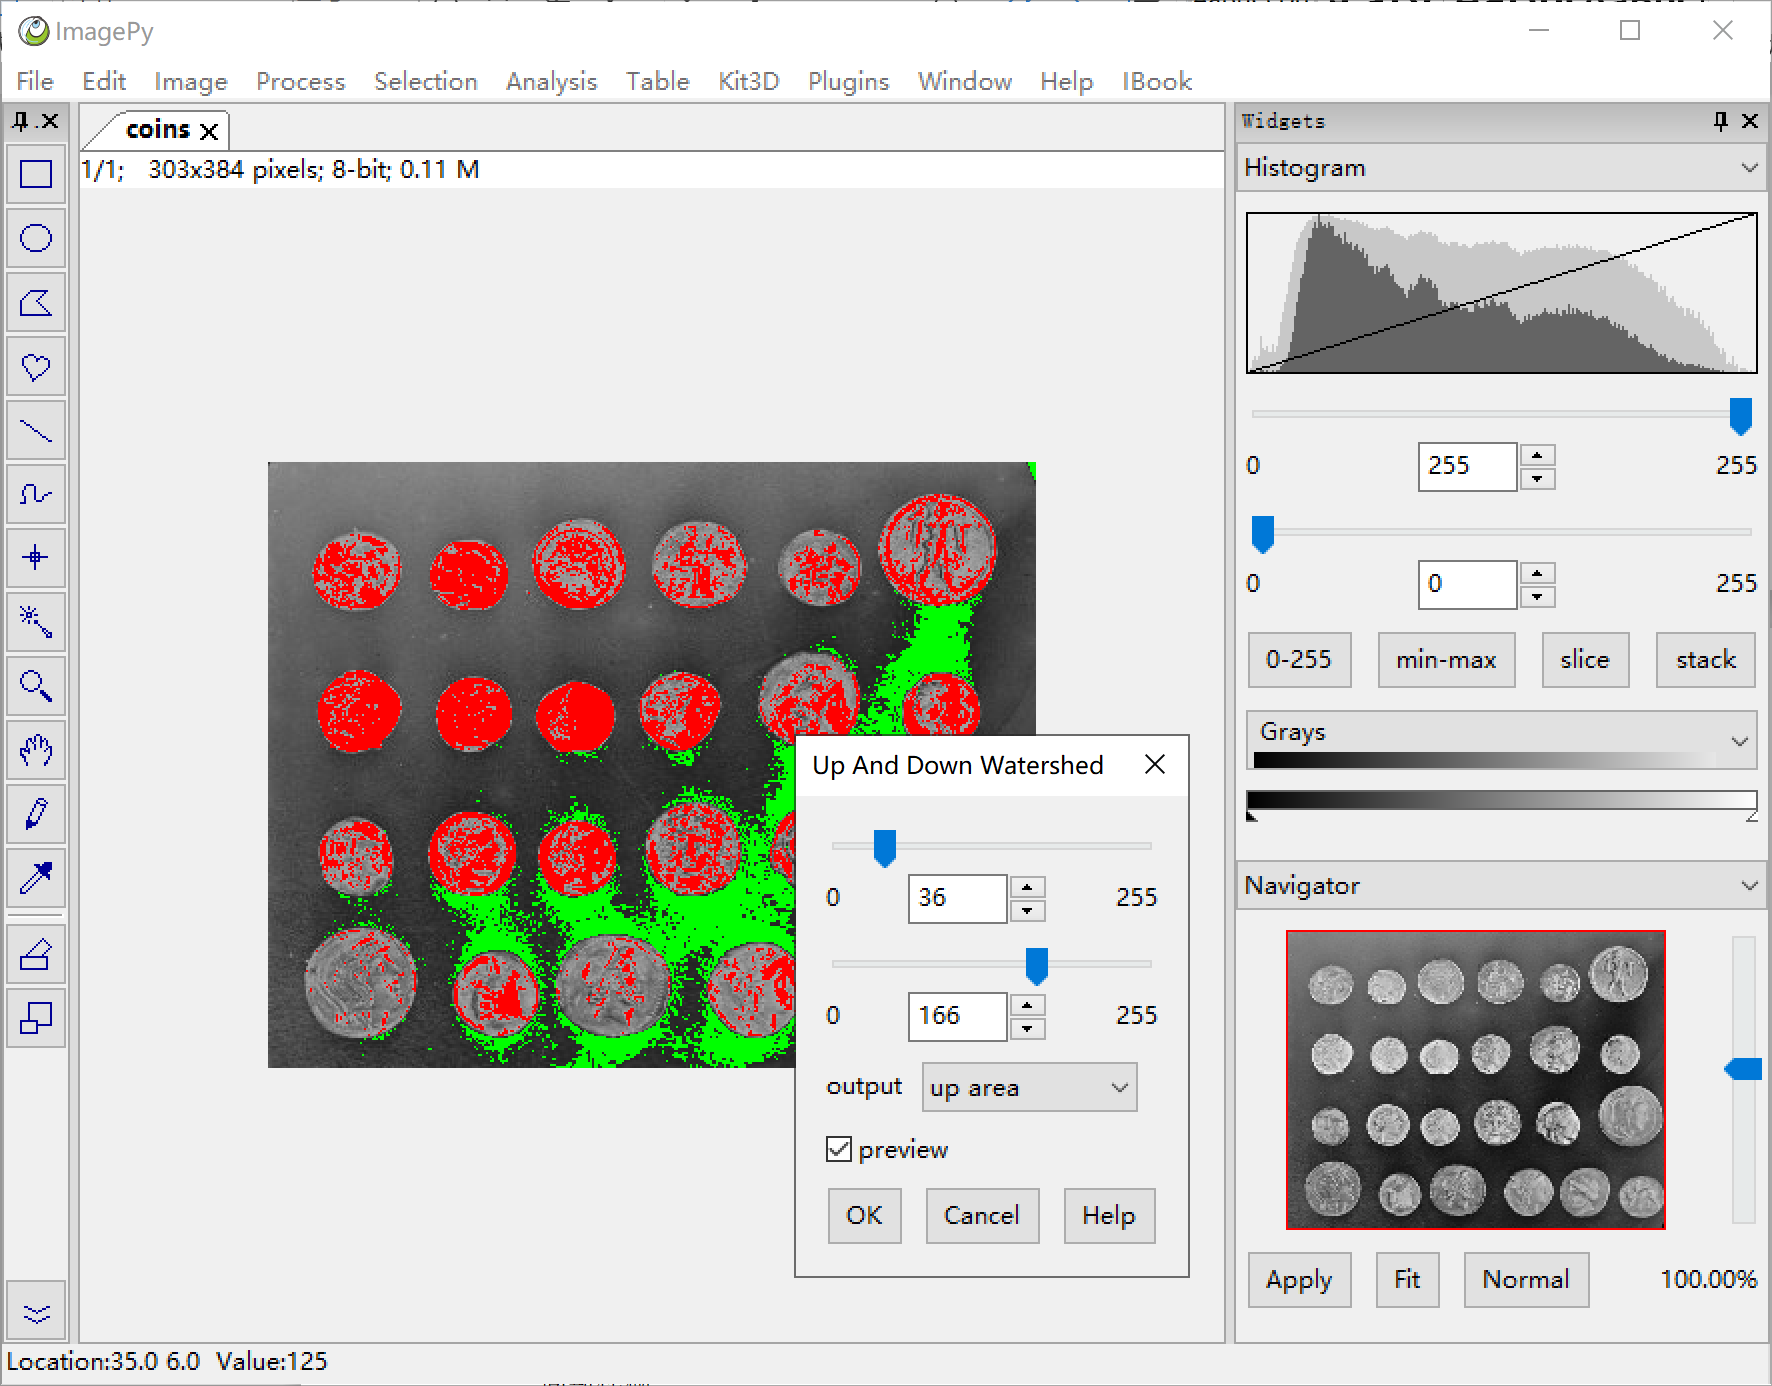
Up And Down Watershed
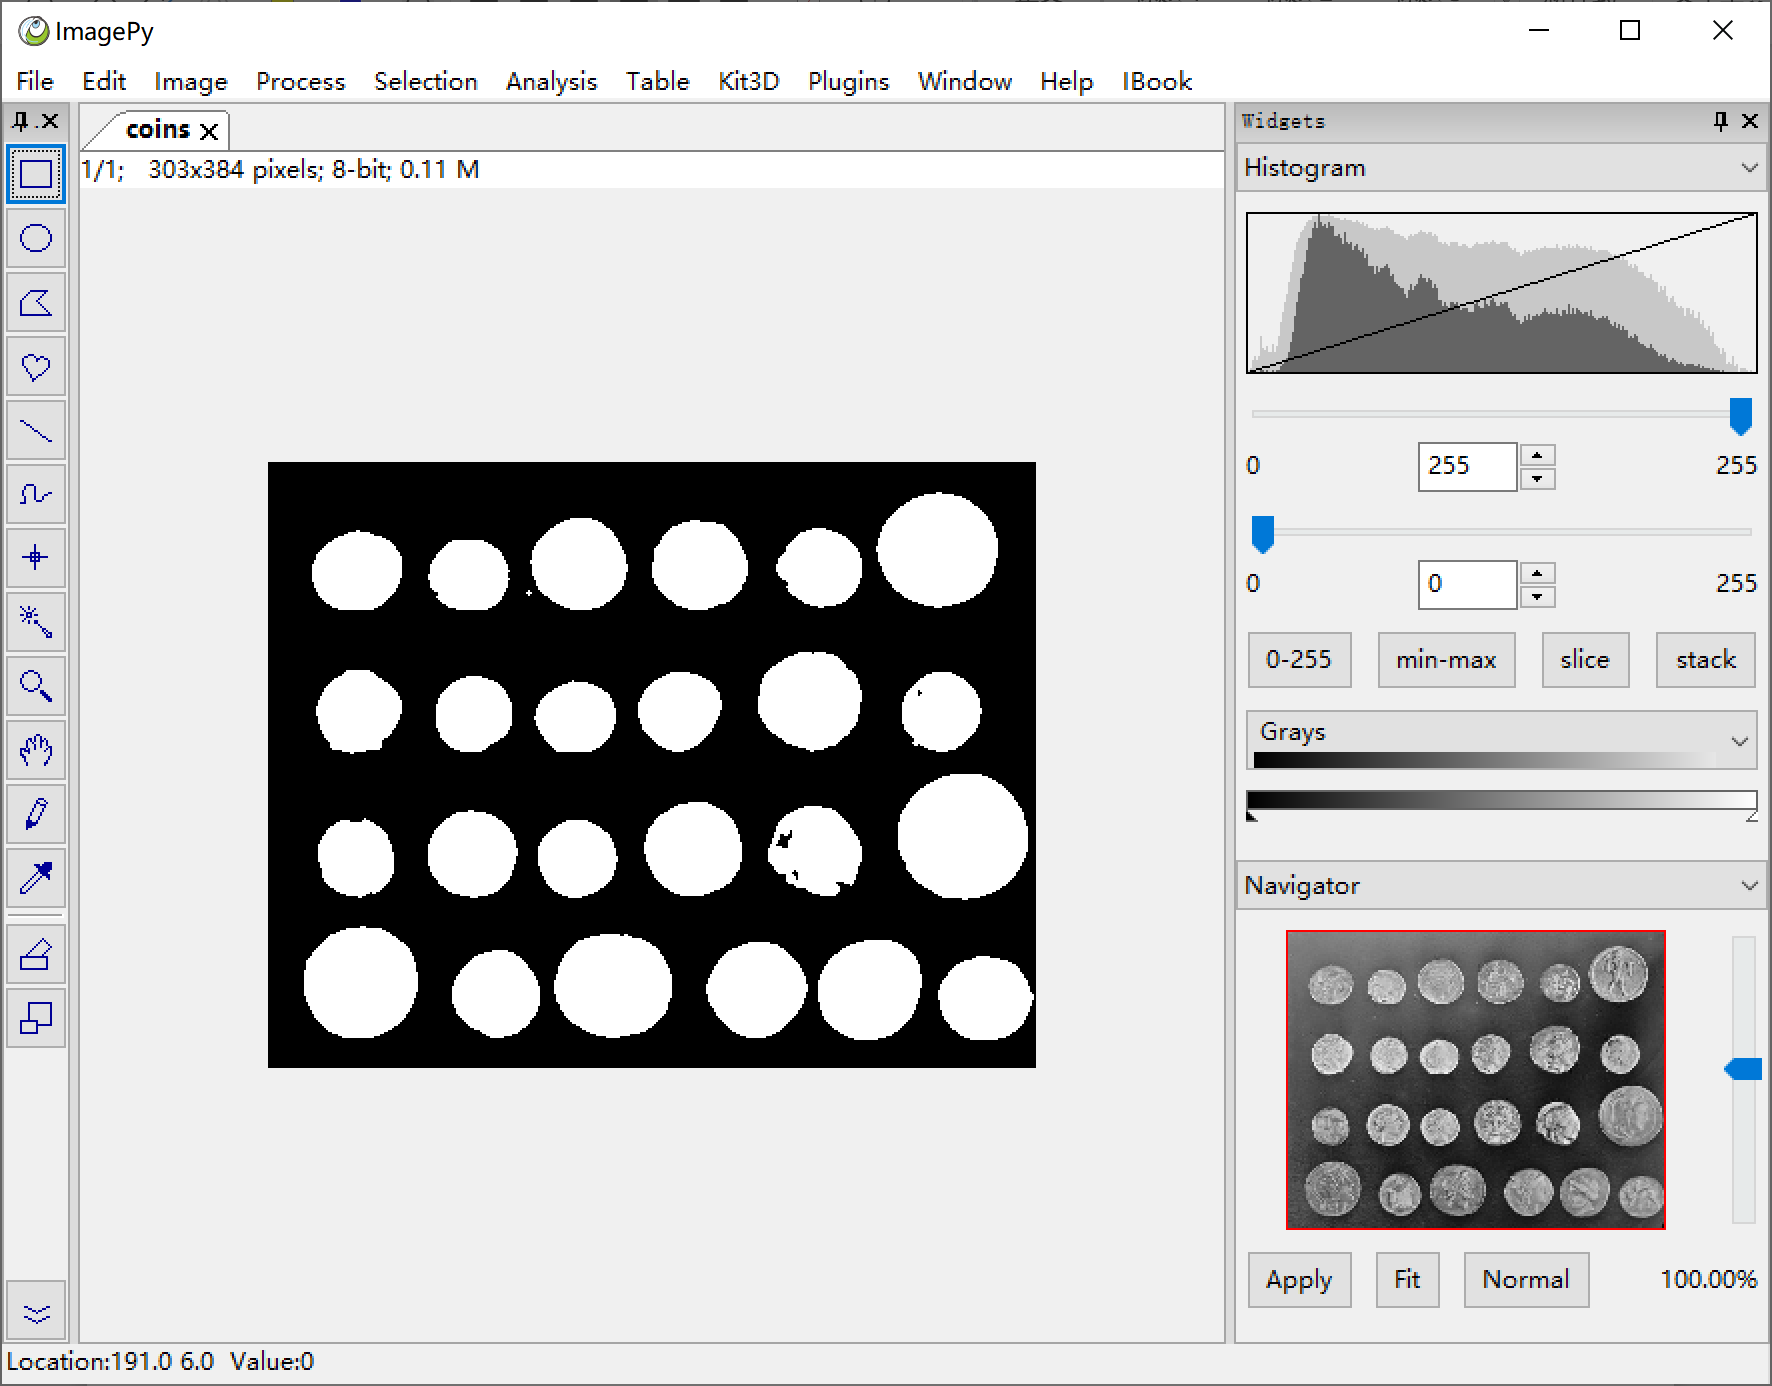
Mask
Binarization
menu:Process -> Binary -> Binary Fill Holes After the segmentation, we obtained a relatively clean mask image, but there is still some hollowing out, as well as some impurities, which will interfere with counting and measurement.
ImagePy supports binary operations such as erode, dilate, opening and closing, as well as skeletonization, central axis extraction, and distance transformation.
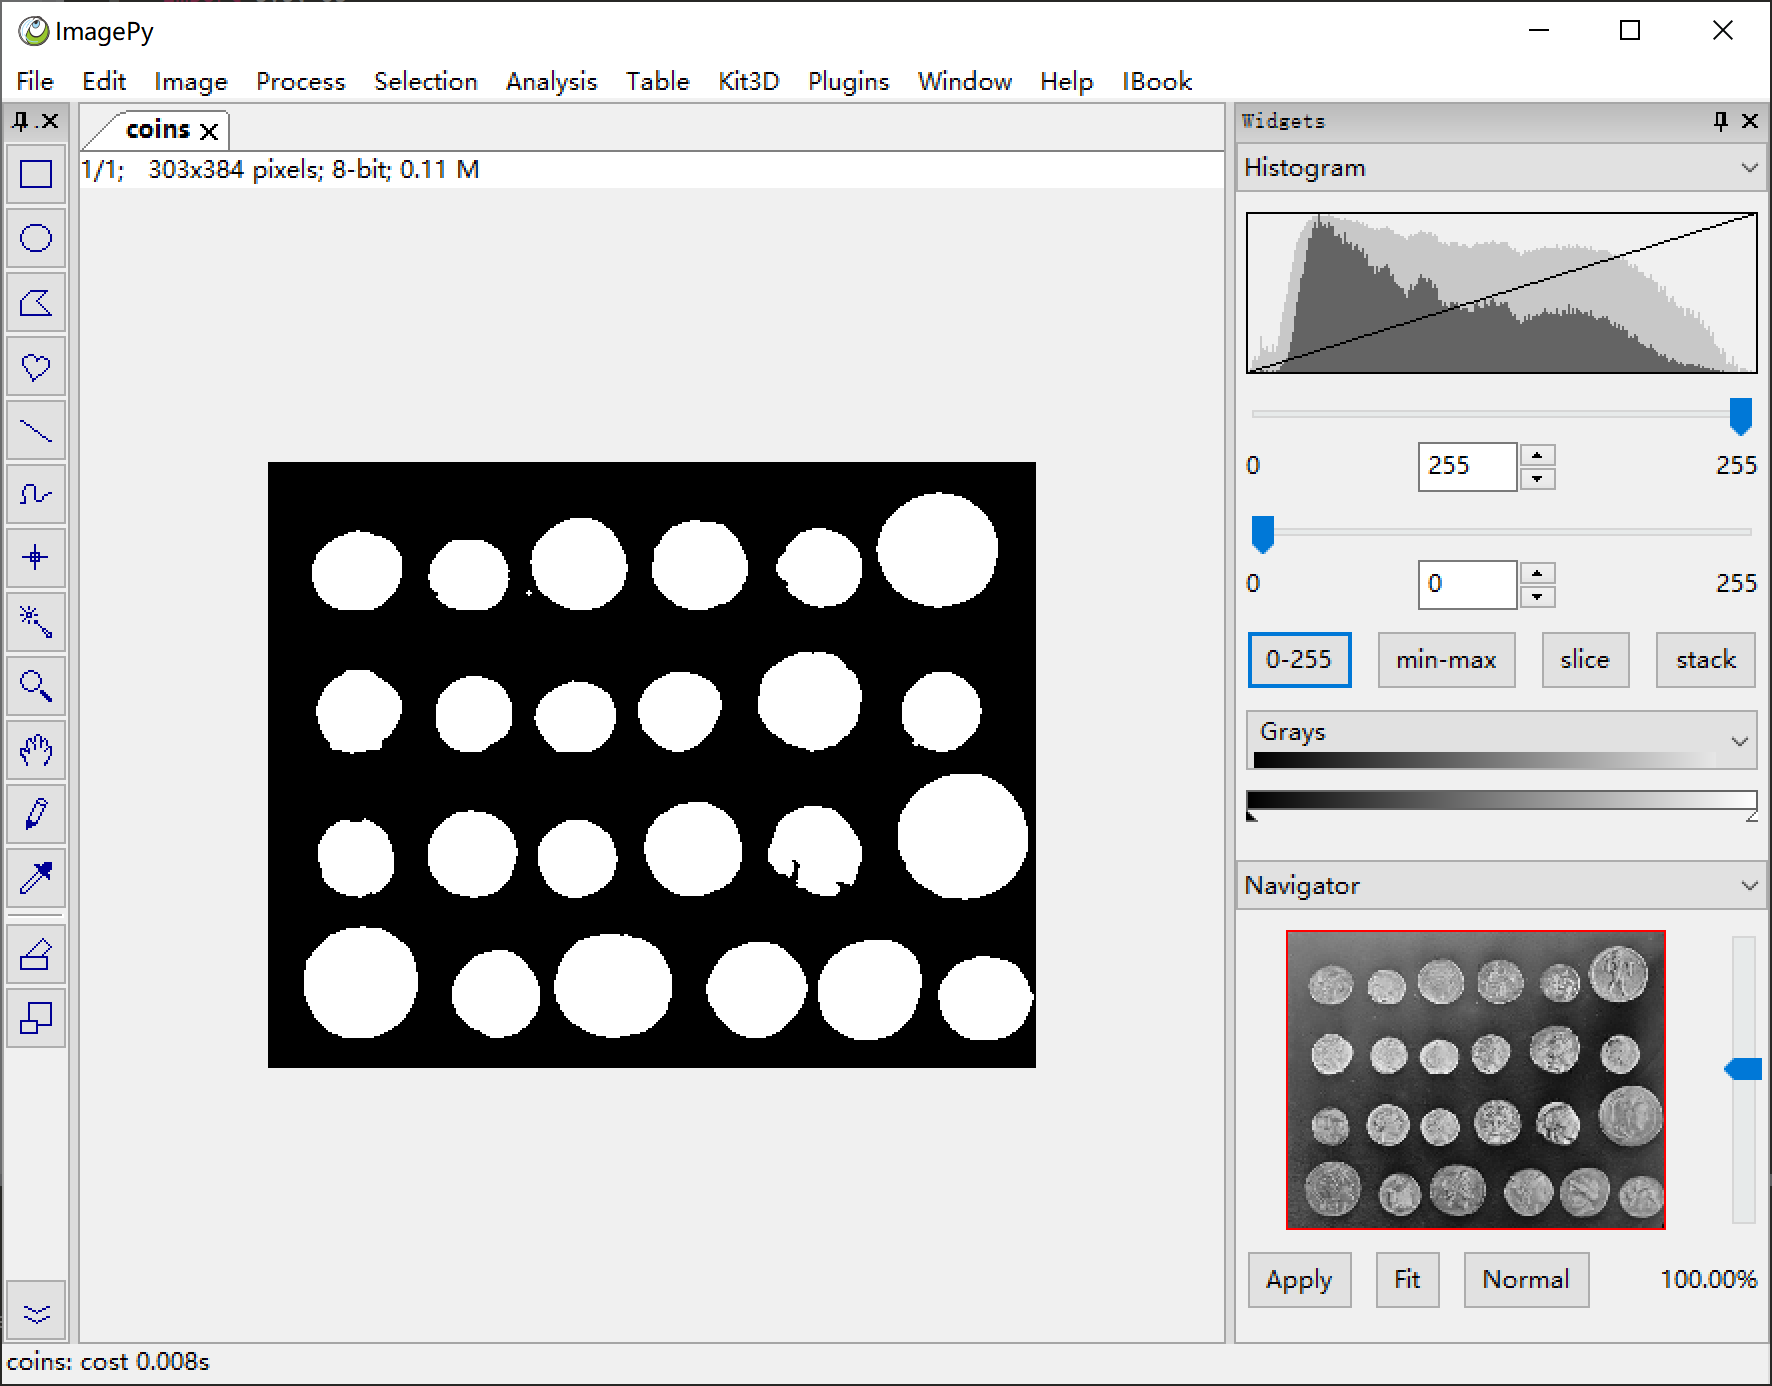
Fill Holes
Geometry filtering
menu:Analysis -> Region Analysis -> Geometry Filter ImagePy can perform geometric filtering based on :the area, the perimeter, the topology, the solidity, the eccentricity and other parameters. You can also use multiple conditions for filtering. Each number can be positive|negative, which indicates the kept object will have the corresponding parameter greater|smaller than the value respectively. The kept objects will be set to the front color, the rejected ones will be set to the back color. In this demo, the back color is set to 100 in order to see which ones are filtered out. Once satisfied with the result, set the back color to 0 to reject them. In addition, ImagePy also supports gray density filtering, color filtering, color clustering and other functions.
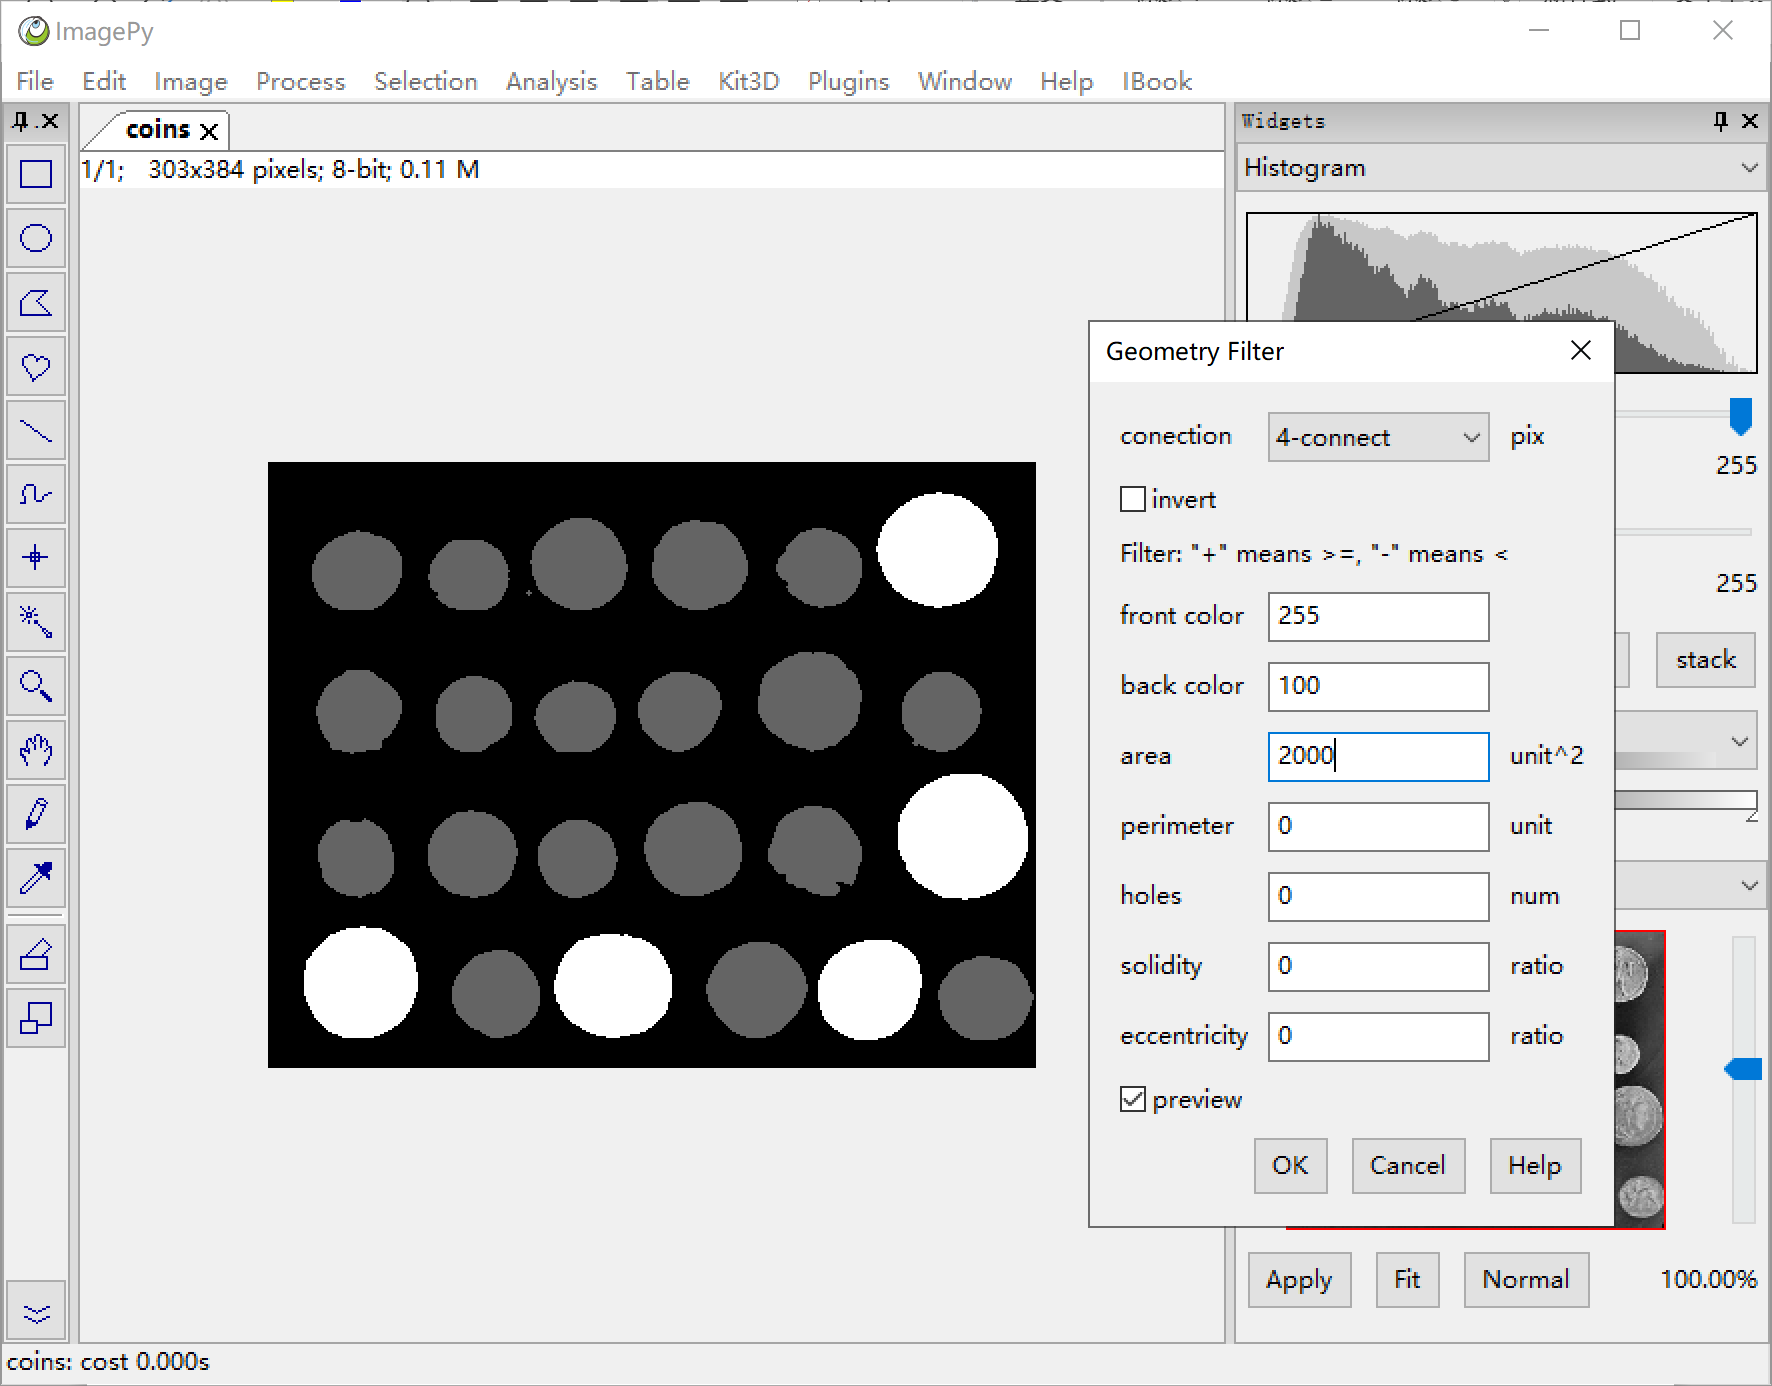
Geometry filtering (the area is over-chosen to emphasize the distinction)
Geometry Analysis
menu:Process -> Region Analysis -> Geometry Analysis Count the area and analyze the parameters. By choosing the cov option, ImagePy will fit each area with an ellipse calculated via the covariance.
The parameters such as area, perimeter, eccentricity, and solidity shown in the previous step are calculated here. In fact, the filtering of the previous step is a downstream analysis of this one.
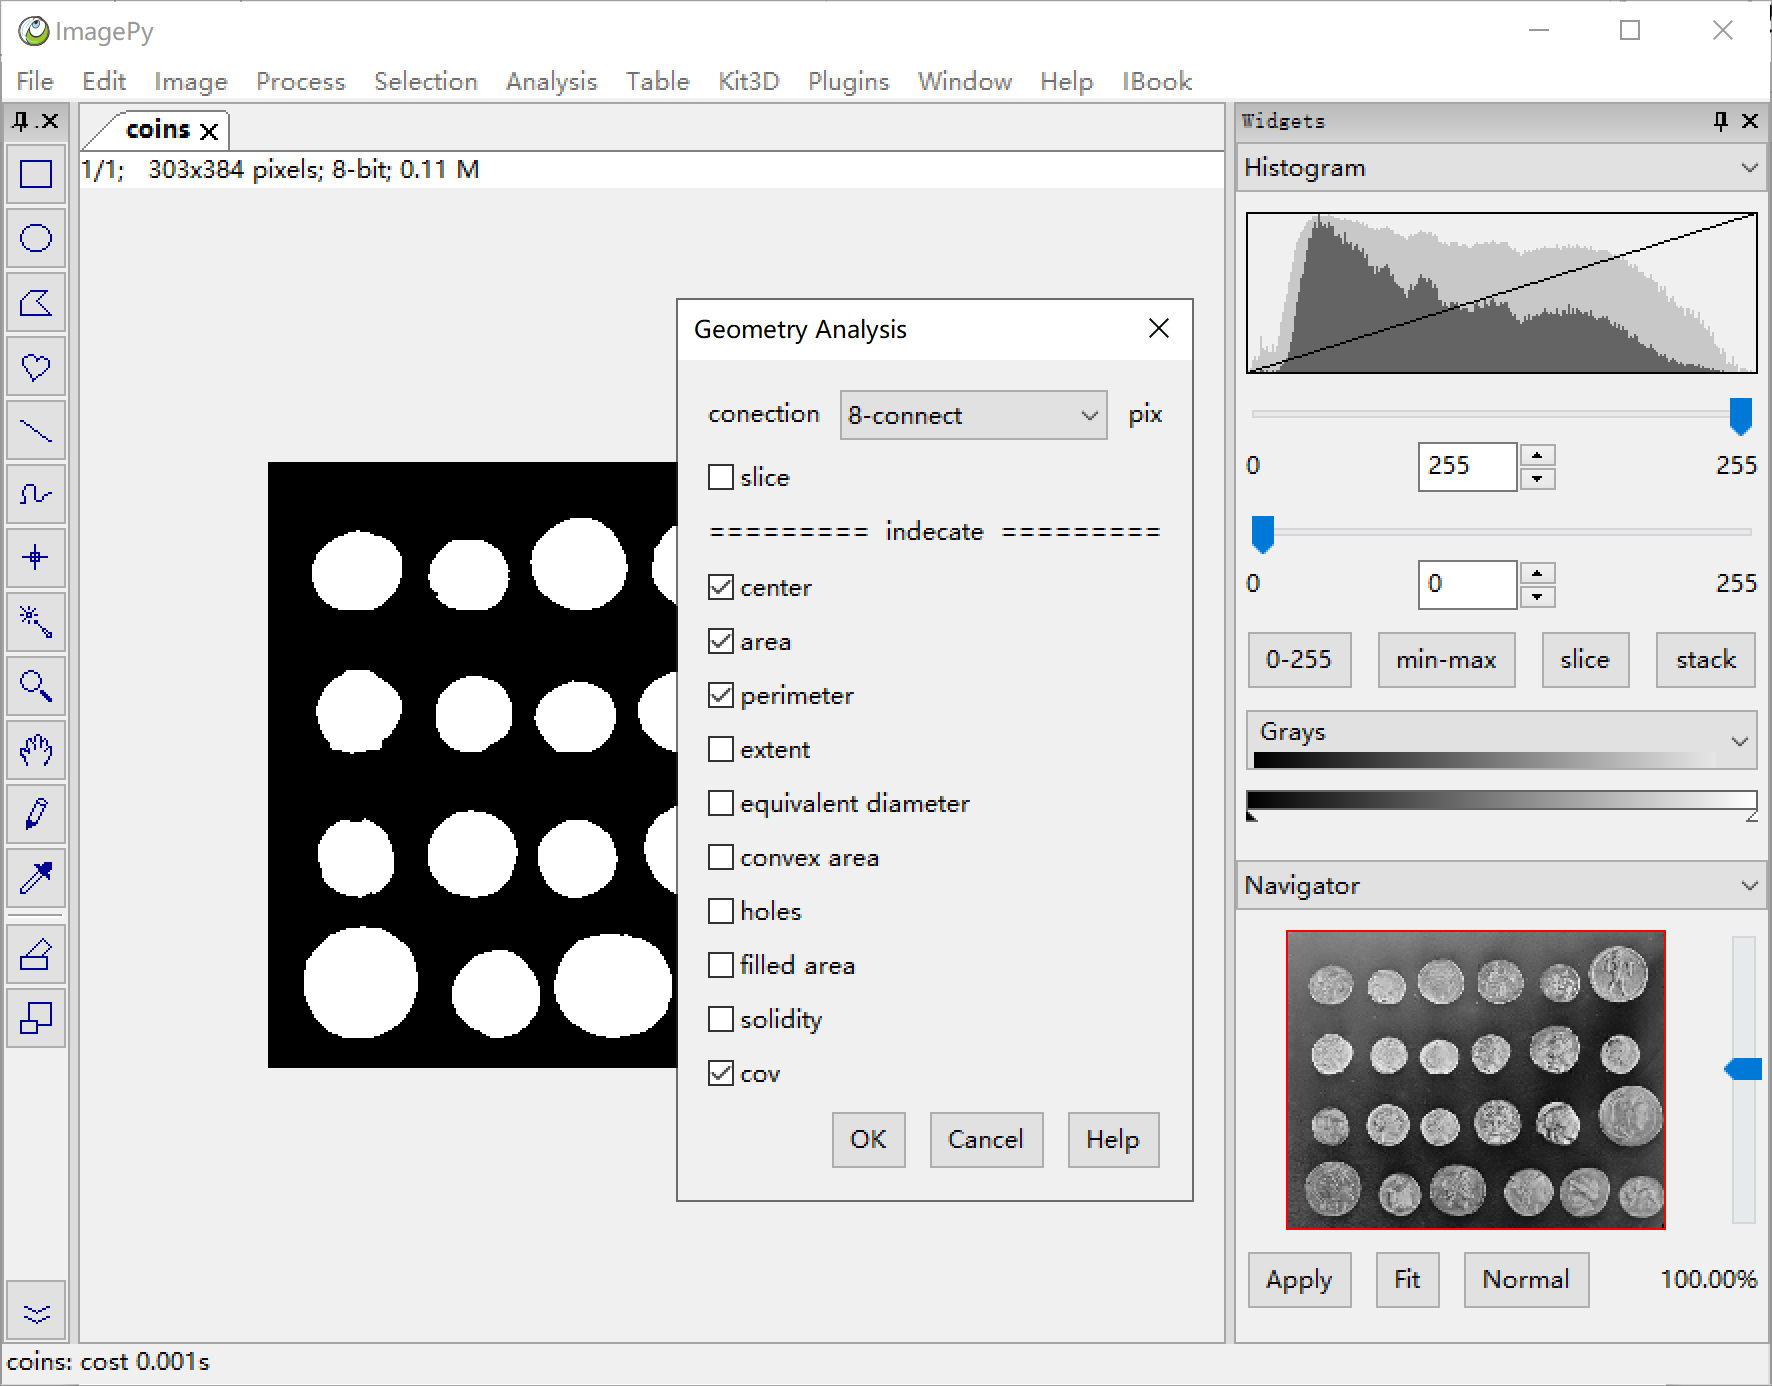
Geometry Analysis
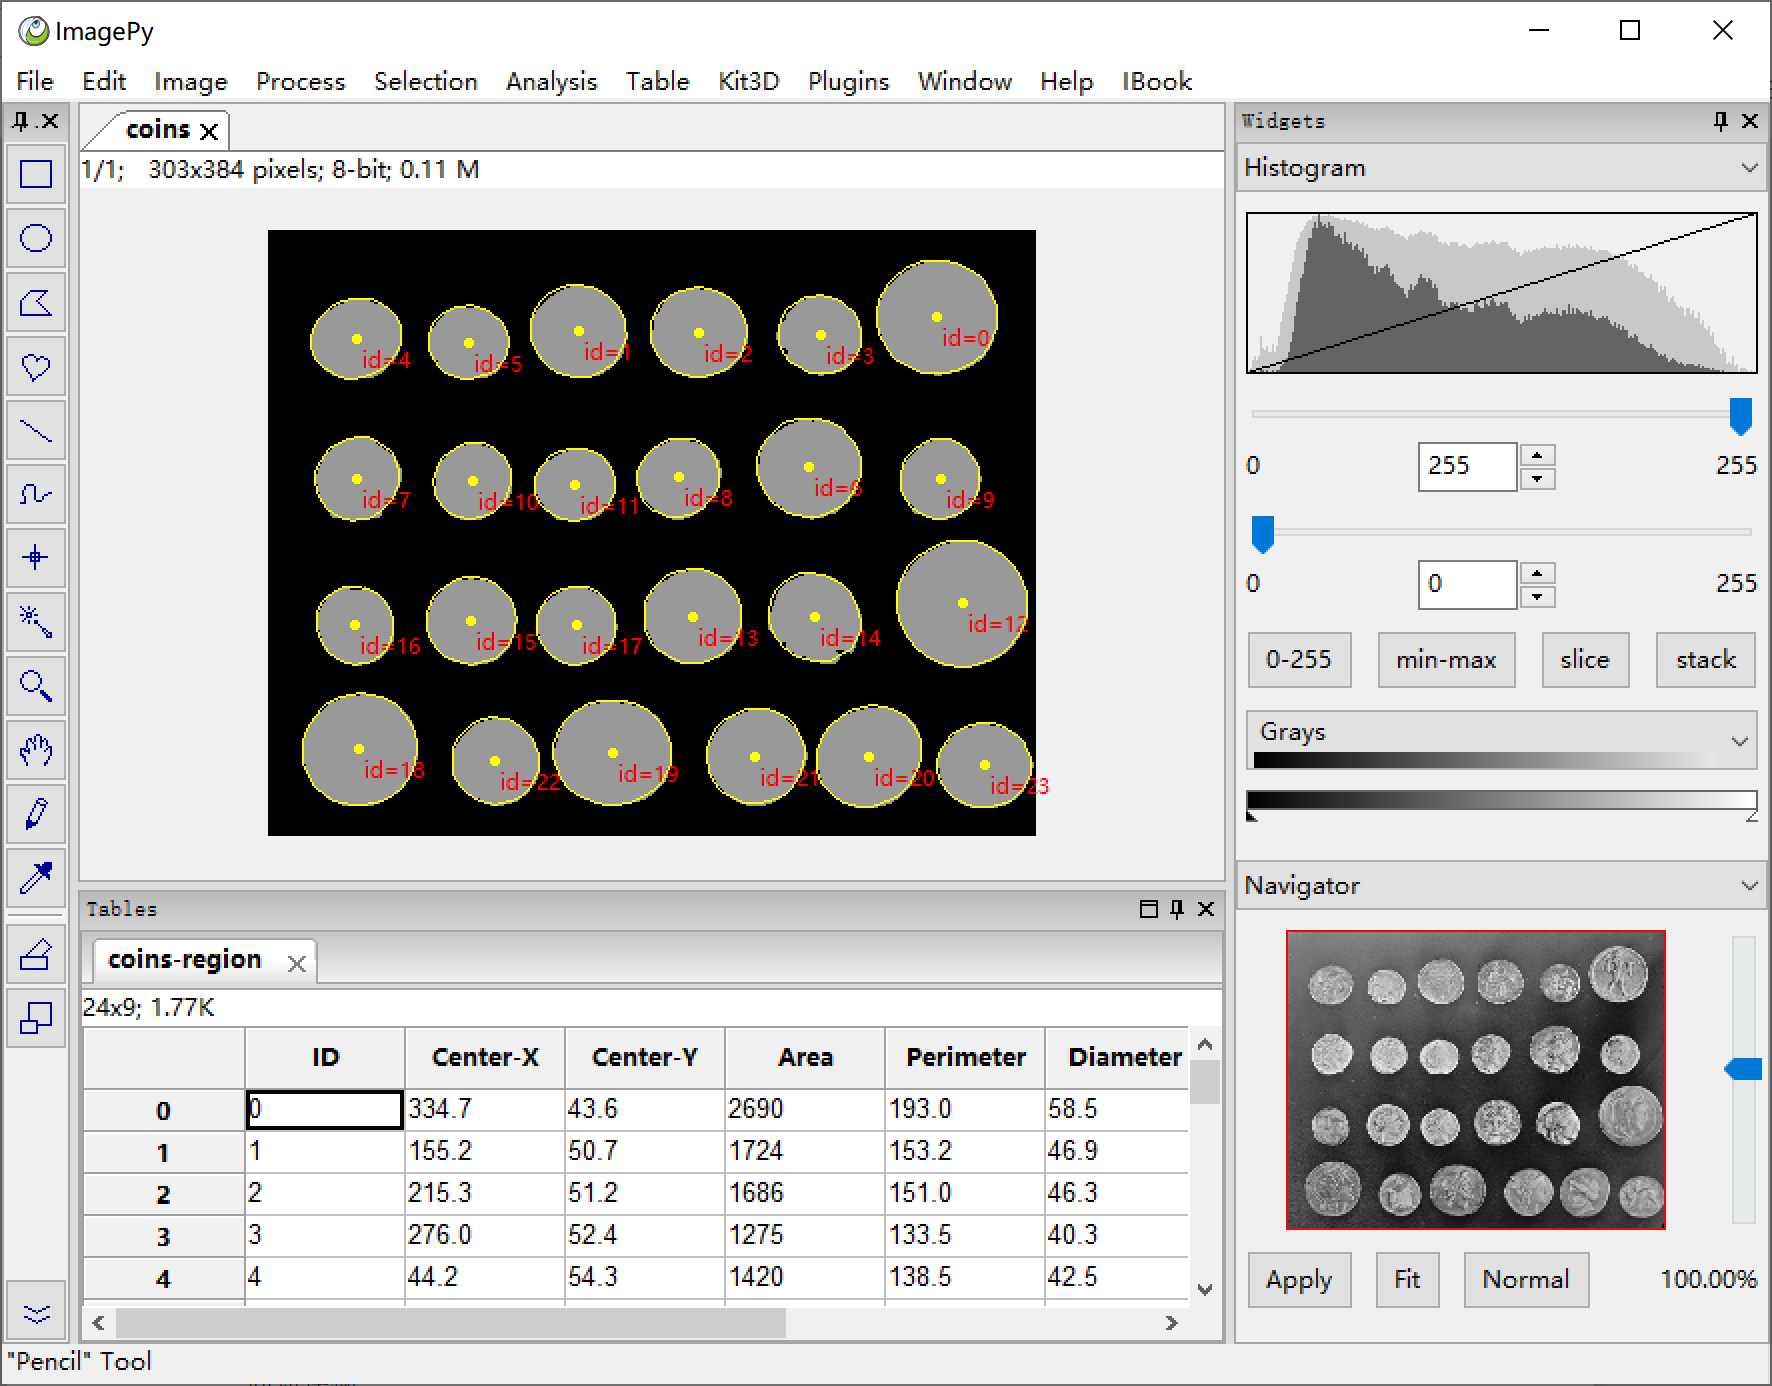
Generate the result table (dark to emphasize the ellipse)
Sort Table by area
menu:Table -> Statistic -> Table Sort By Key Select the major key as area, and select descend. The table will be sorted in descending order of area. A table is another important piece of data other than an image. In a sense, many times we need to get the required information on the image and then post-process the data in the form of a table. ImagePy supports table I/O (xls, xlsx, csv), filtering, slicing, statistical analysis, sorting and more. (Right click on the column header to set the text color, decimal precision, line style, etc.)
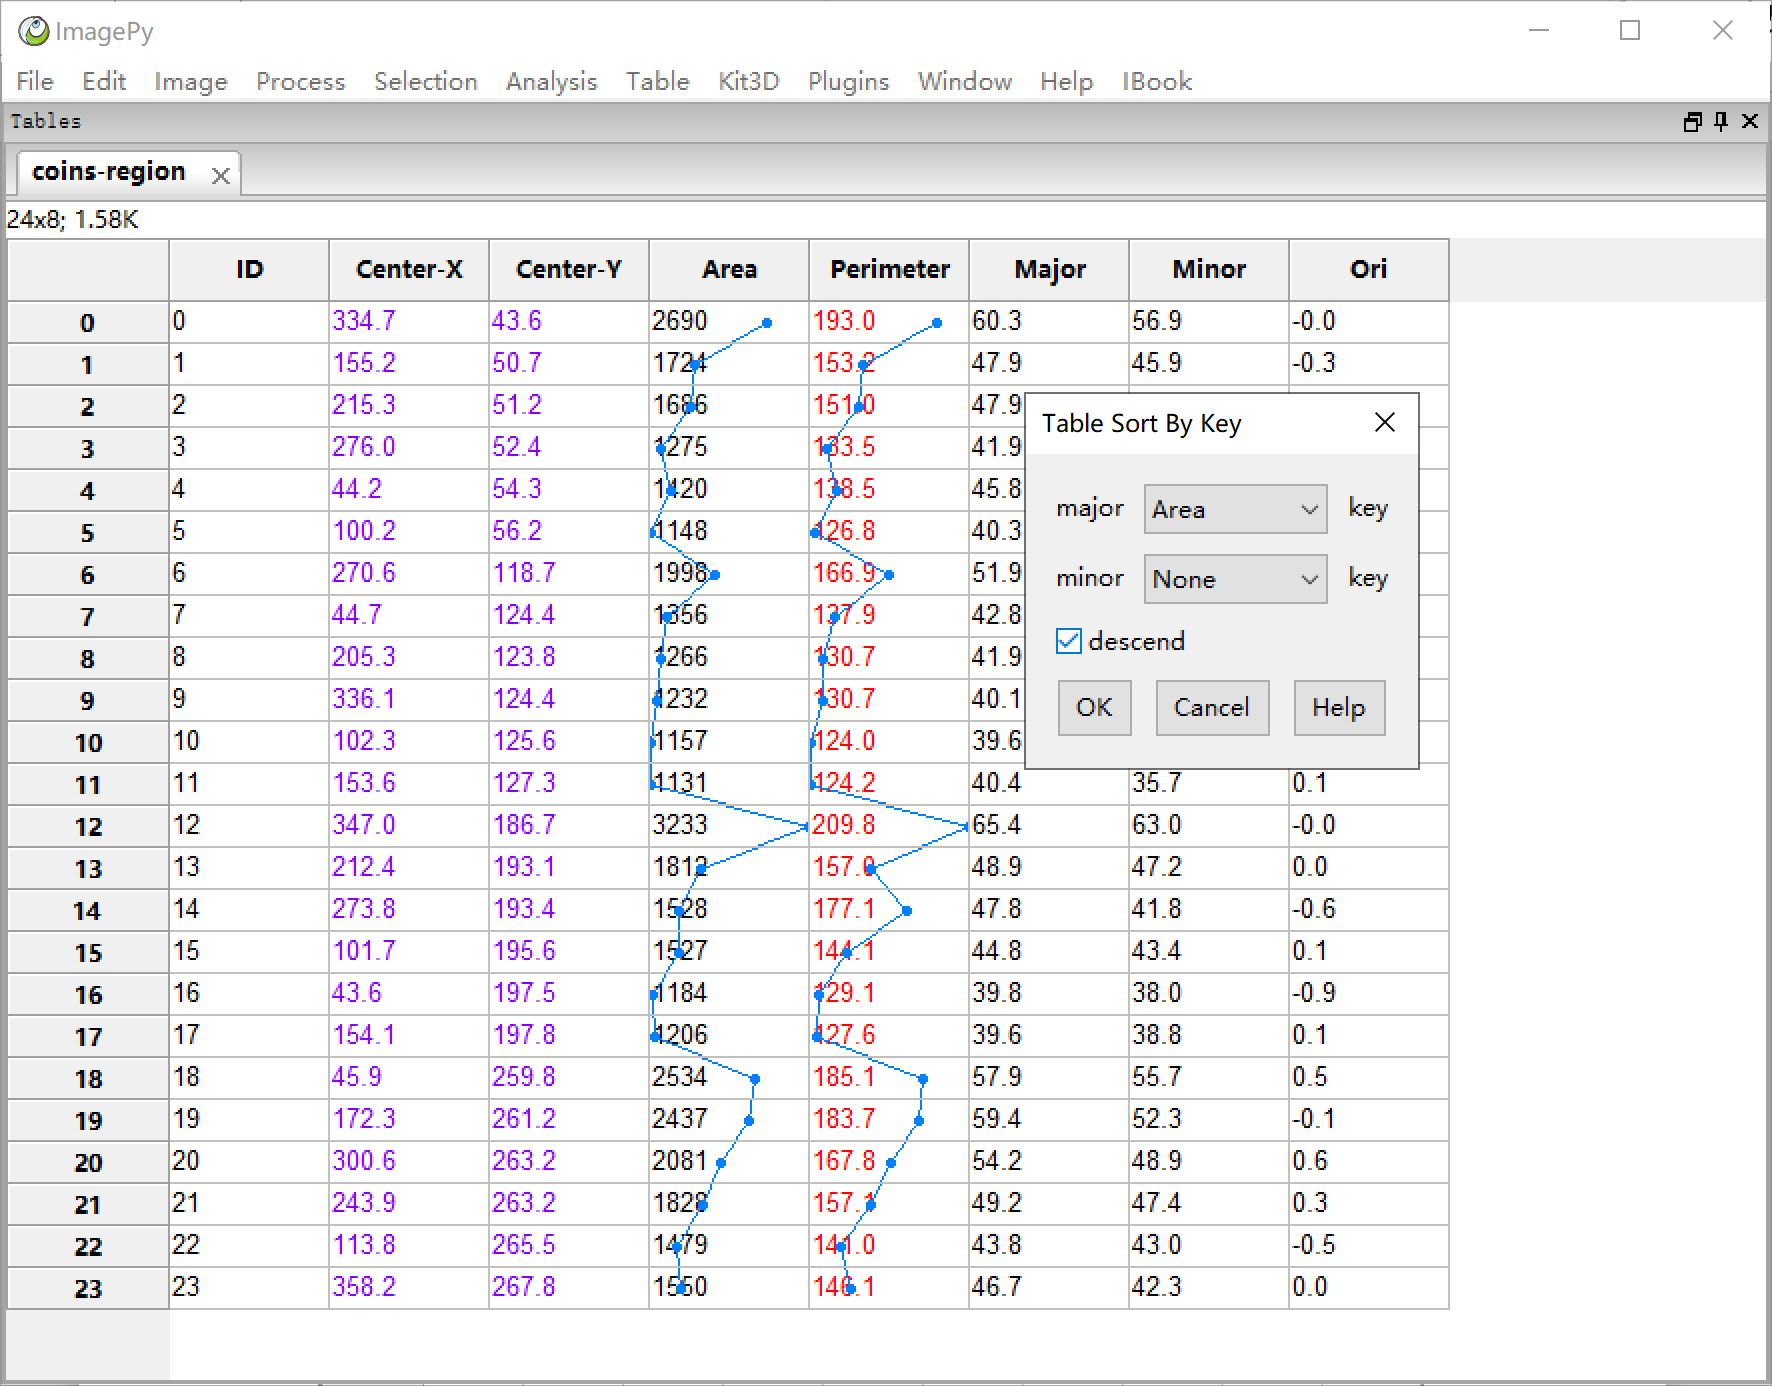
Table
Charts
menu:Table -> Chart -> Hist Chart From tabular data, we often need to draw a graph. Here, we plot the histograms of the area and the perimeter columns. ImagePy's tables can be used to draw common charts such as line charts, pie charts, histograms, and scatter plots (matplotlib-based). The chart comes with zooming, moving and other functions. The table can also be saved as an image.
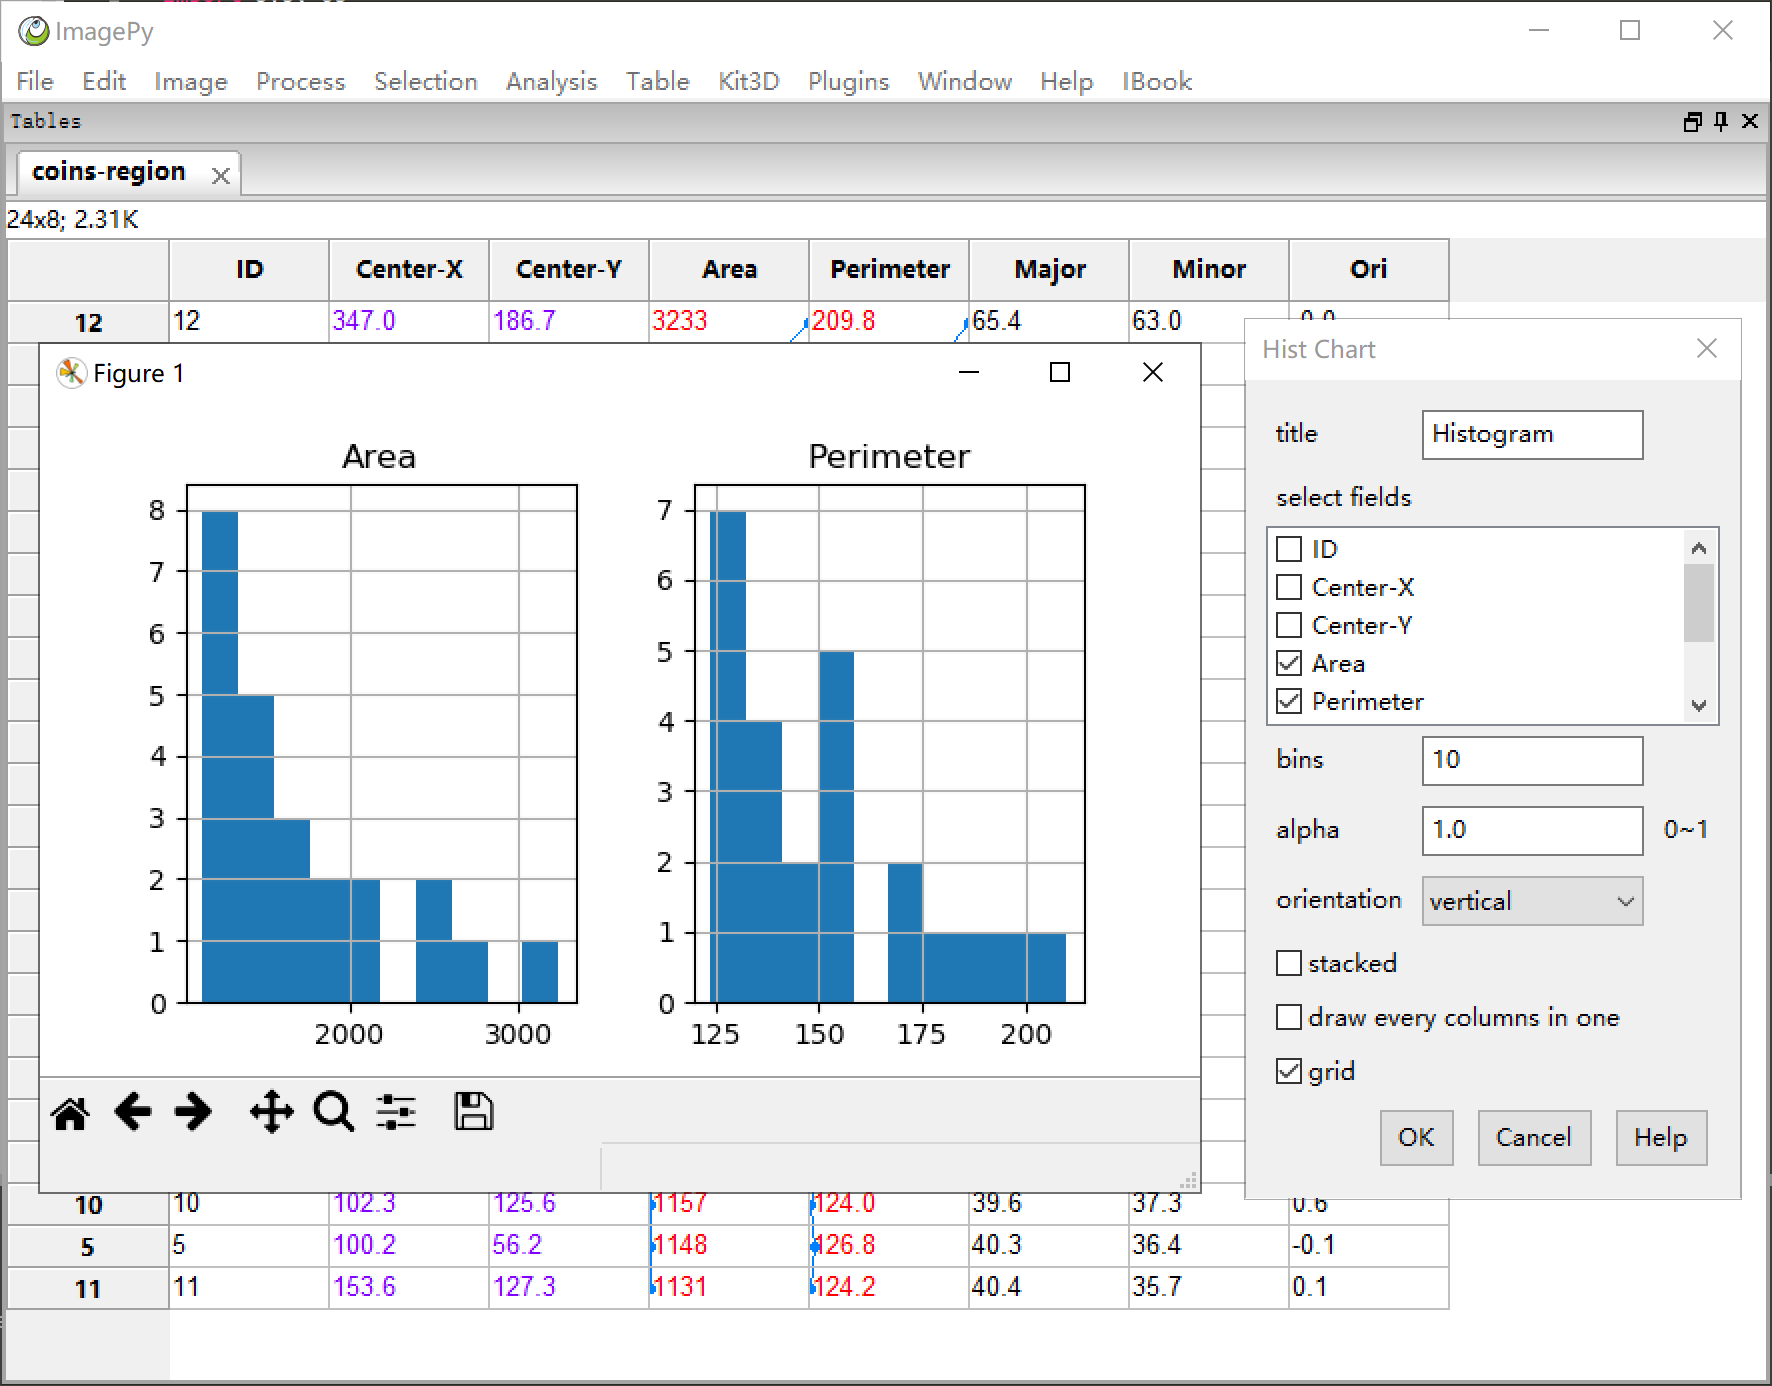
Histograms
3D chart
menu:Kit3D -> Viewer 3D -> 2D Surface Surface reconstruction of the image. This image shows the three reconstructed results including, sobel gradient map, high threshold and low threshold. It shows how the Up And Down Watershed works:
- calculate the gradient.
- mark the coin and background through the high and low thresholds,
- simulate the rising water on the dem diagram to form the segmentation.
ImagePy can perform 3D filtering of images, 3D skeletons, 3D topological analysis, 2D surface reconstruction, and 3D surface visualization. The 3D view can be freely dragged, rotated, and the image results can be saved as a .stl file.
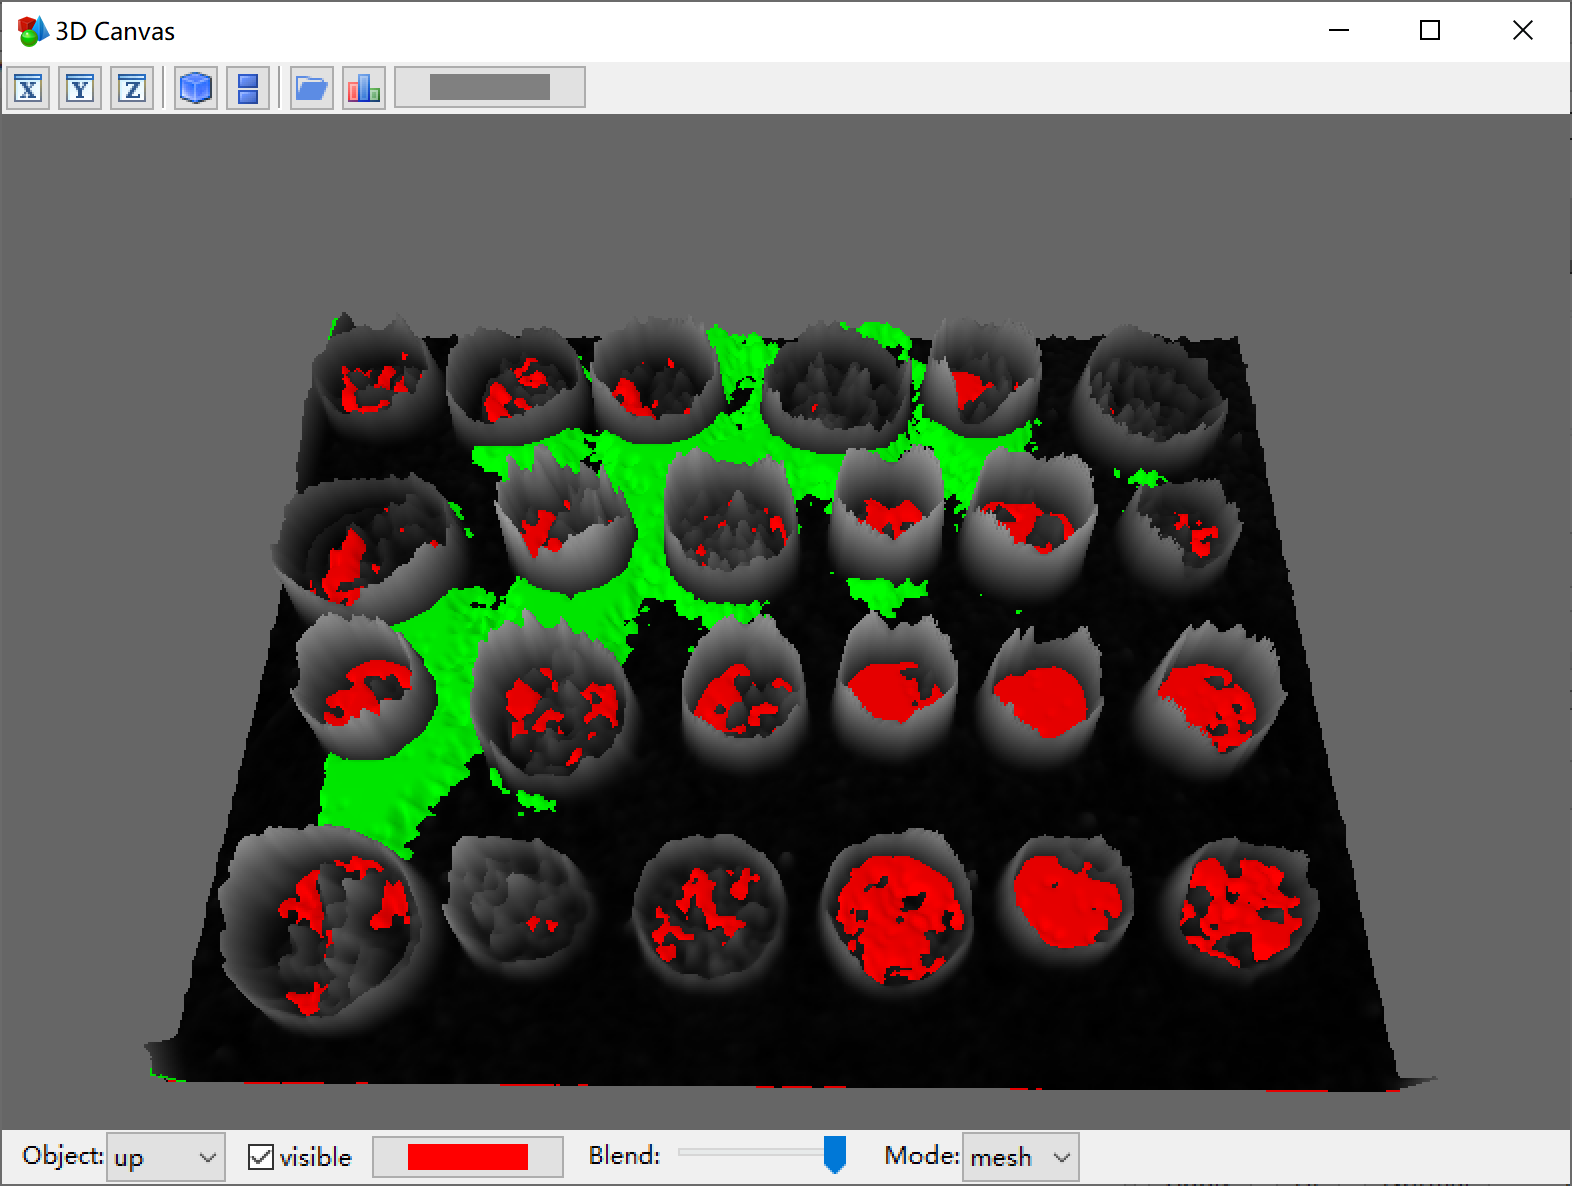
3D visualisation
Macro recording and execution
menu:Window -> Develop Tool Suite Macro recorder is shown in the develop tool panel. We have manually completed an image segmentation. However, batch processing more than 10 images can be tedious. So, assuming that these steps are highly repeatable and robust for dealing with such problems, we can record a macro to combine several processes into a one-click program. The macro recorder is similar to a radio recorder. When it is turned on, each step of the operation will be recorded. We can click the pause button to stop recording, then click the play button to execute. When the macro is running, the recorded commands will be executed sequentially, therefore achieving simplicity and reproducibility.
Macros are saved into .mc files. drag and drop the file to the status bar at the bottom of ImagePy, the macro will be executed automatically. we can also copy the .mc file to the submenu of the menus under the ImagePy file directory. When ImagePy is started, the macro file will be parsed into a menu item at the corresponding location. By clicking the menu, the macro will also be executed.
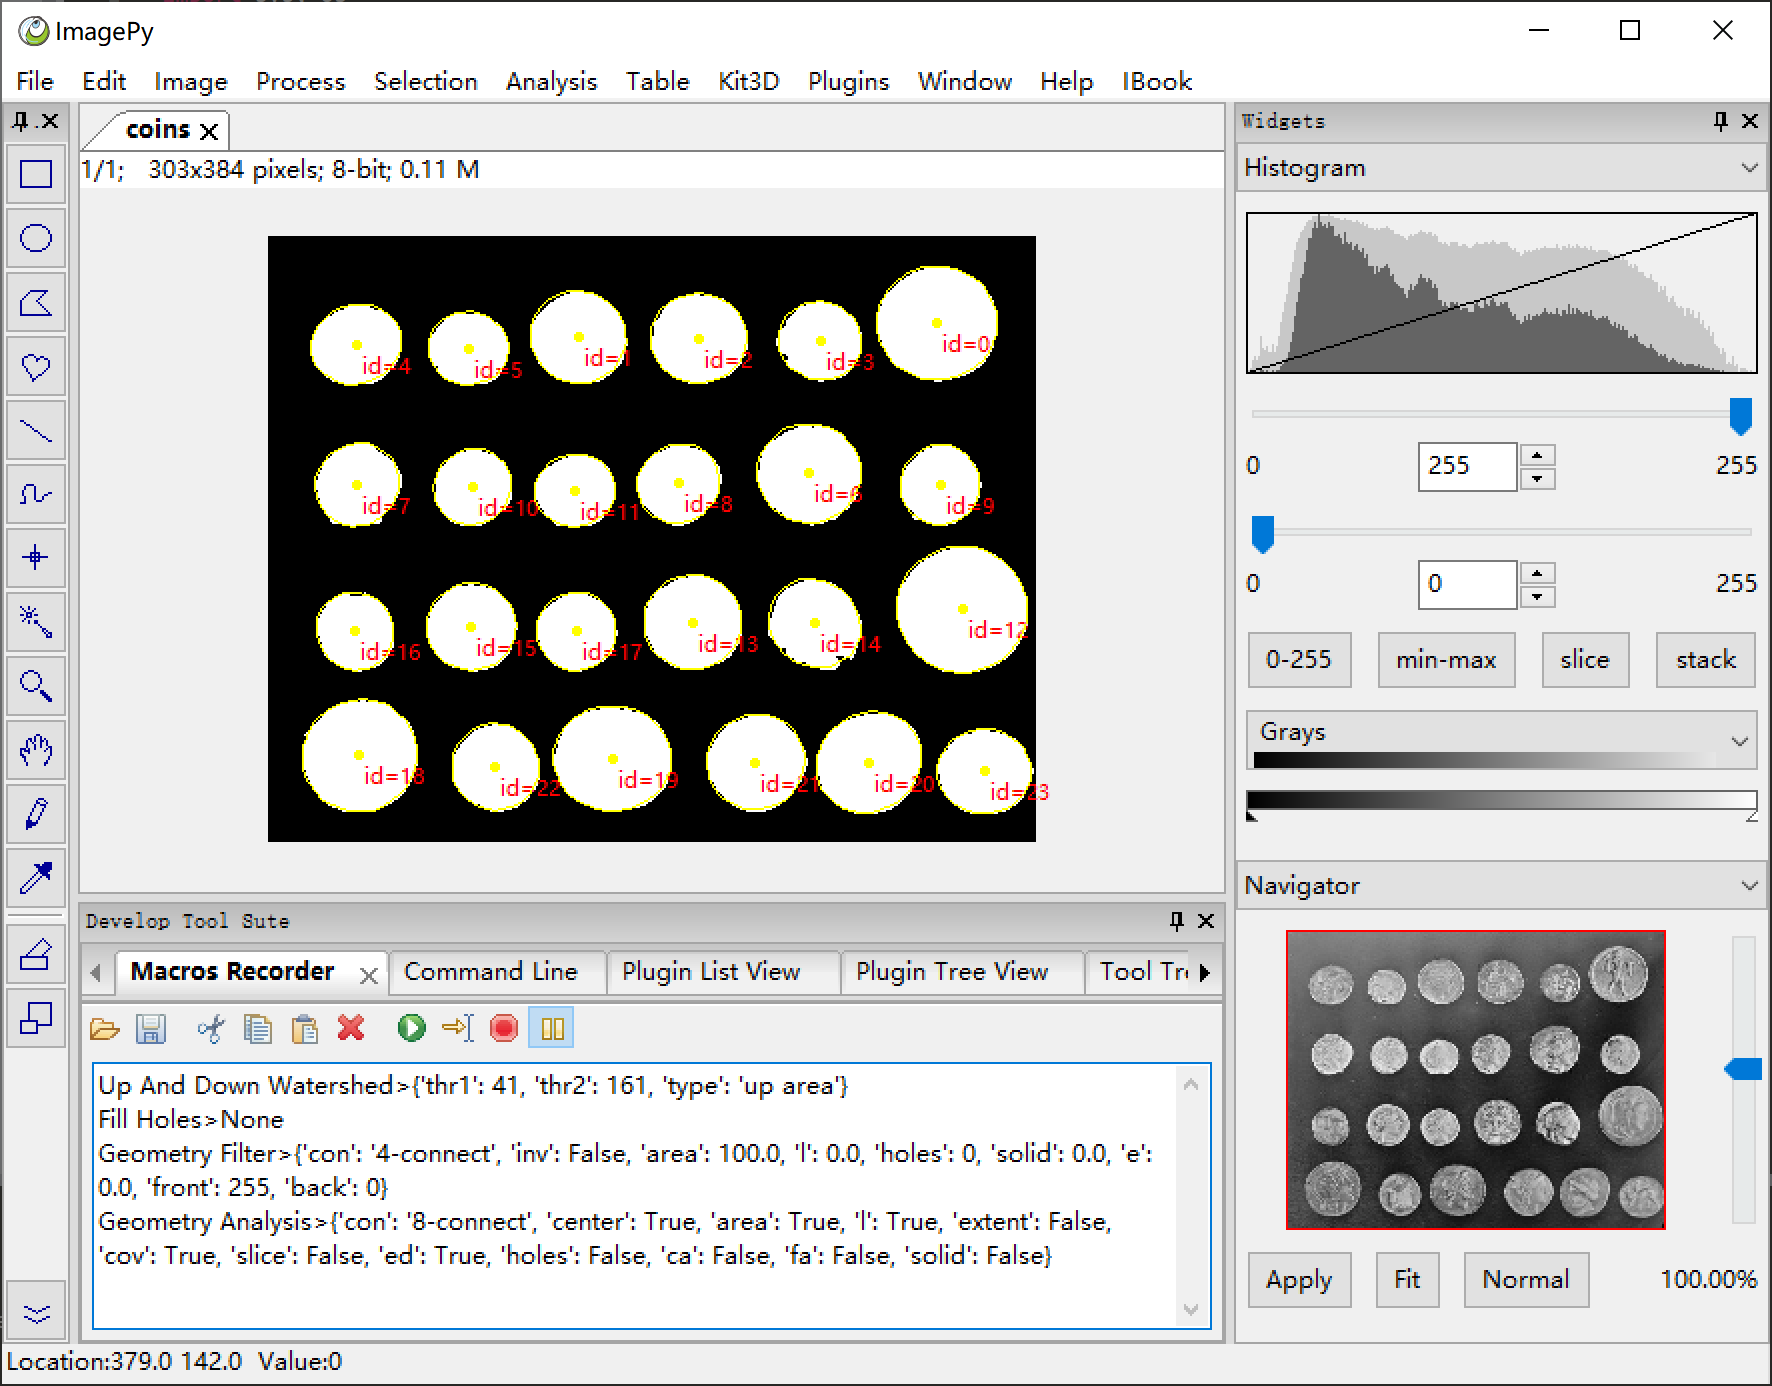
Macro Recording
Workflow
A macro is a sequence of predefined commands. By recording a series of fixed operations into macros, you can improve your work efficiency. However, the disadvantage is the lack of flexibility. For example, sometimes the main steps are fixed, but the parameter tuning needs human interaction. In this case, the workflow is what you want. A workflow in ImagePy is a flow chart that can be visualized, divided into two levels: chapters and sections.
The chapter corresponds to a rectangular area in the flow chart, and the section is a button in the rectangular area, which is also a command and is accompanied by a graphic explanation. The message window on the right will display the corresponding function description, while mousing hovering above. Click on the Detail Document in the top right corner to see the documentation of the entire process.
The workflow is actually written in MarkDown (a markup language), but it needs to be written respecting several specifications, as follows:
Title
=====
## Chapter1
1. Section1
some coment for section1 ...
2. ...
## Chapter 2
    ...
Workflow
Report Plugin
Sometimes we need to make a report to print or generate a PDF document. ImagePy can generate report from a xlsx template. We just need put specific mark in some cells, ImagePy will parse the template and generate a parameter dialog, then we can input some information, or give image/table in, the report will be generated! more about how to make template please see here.
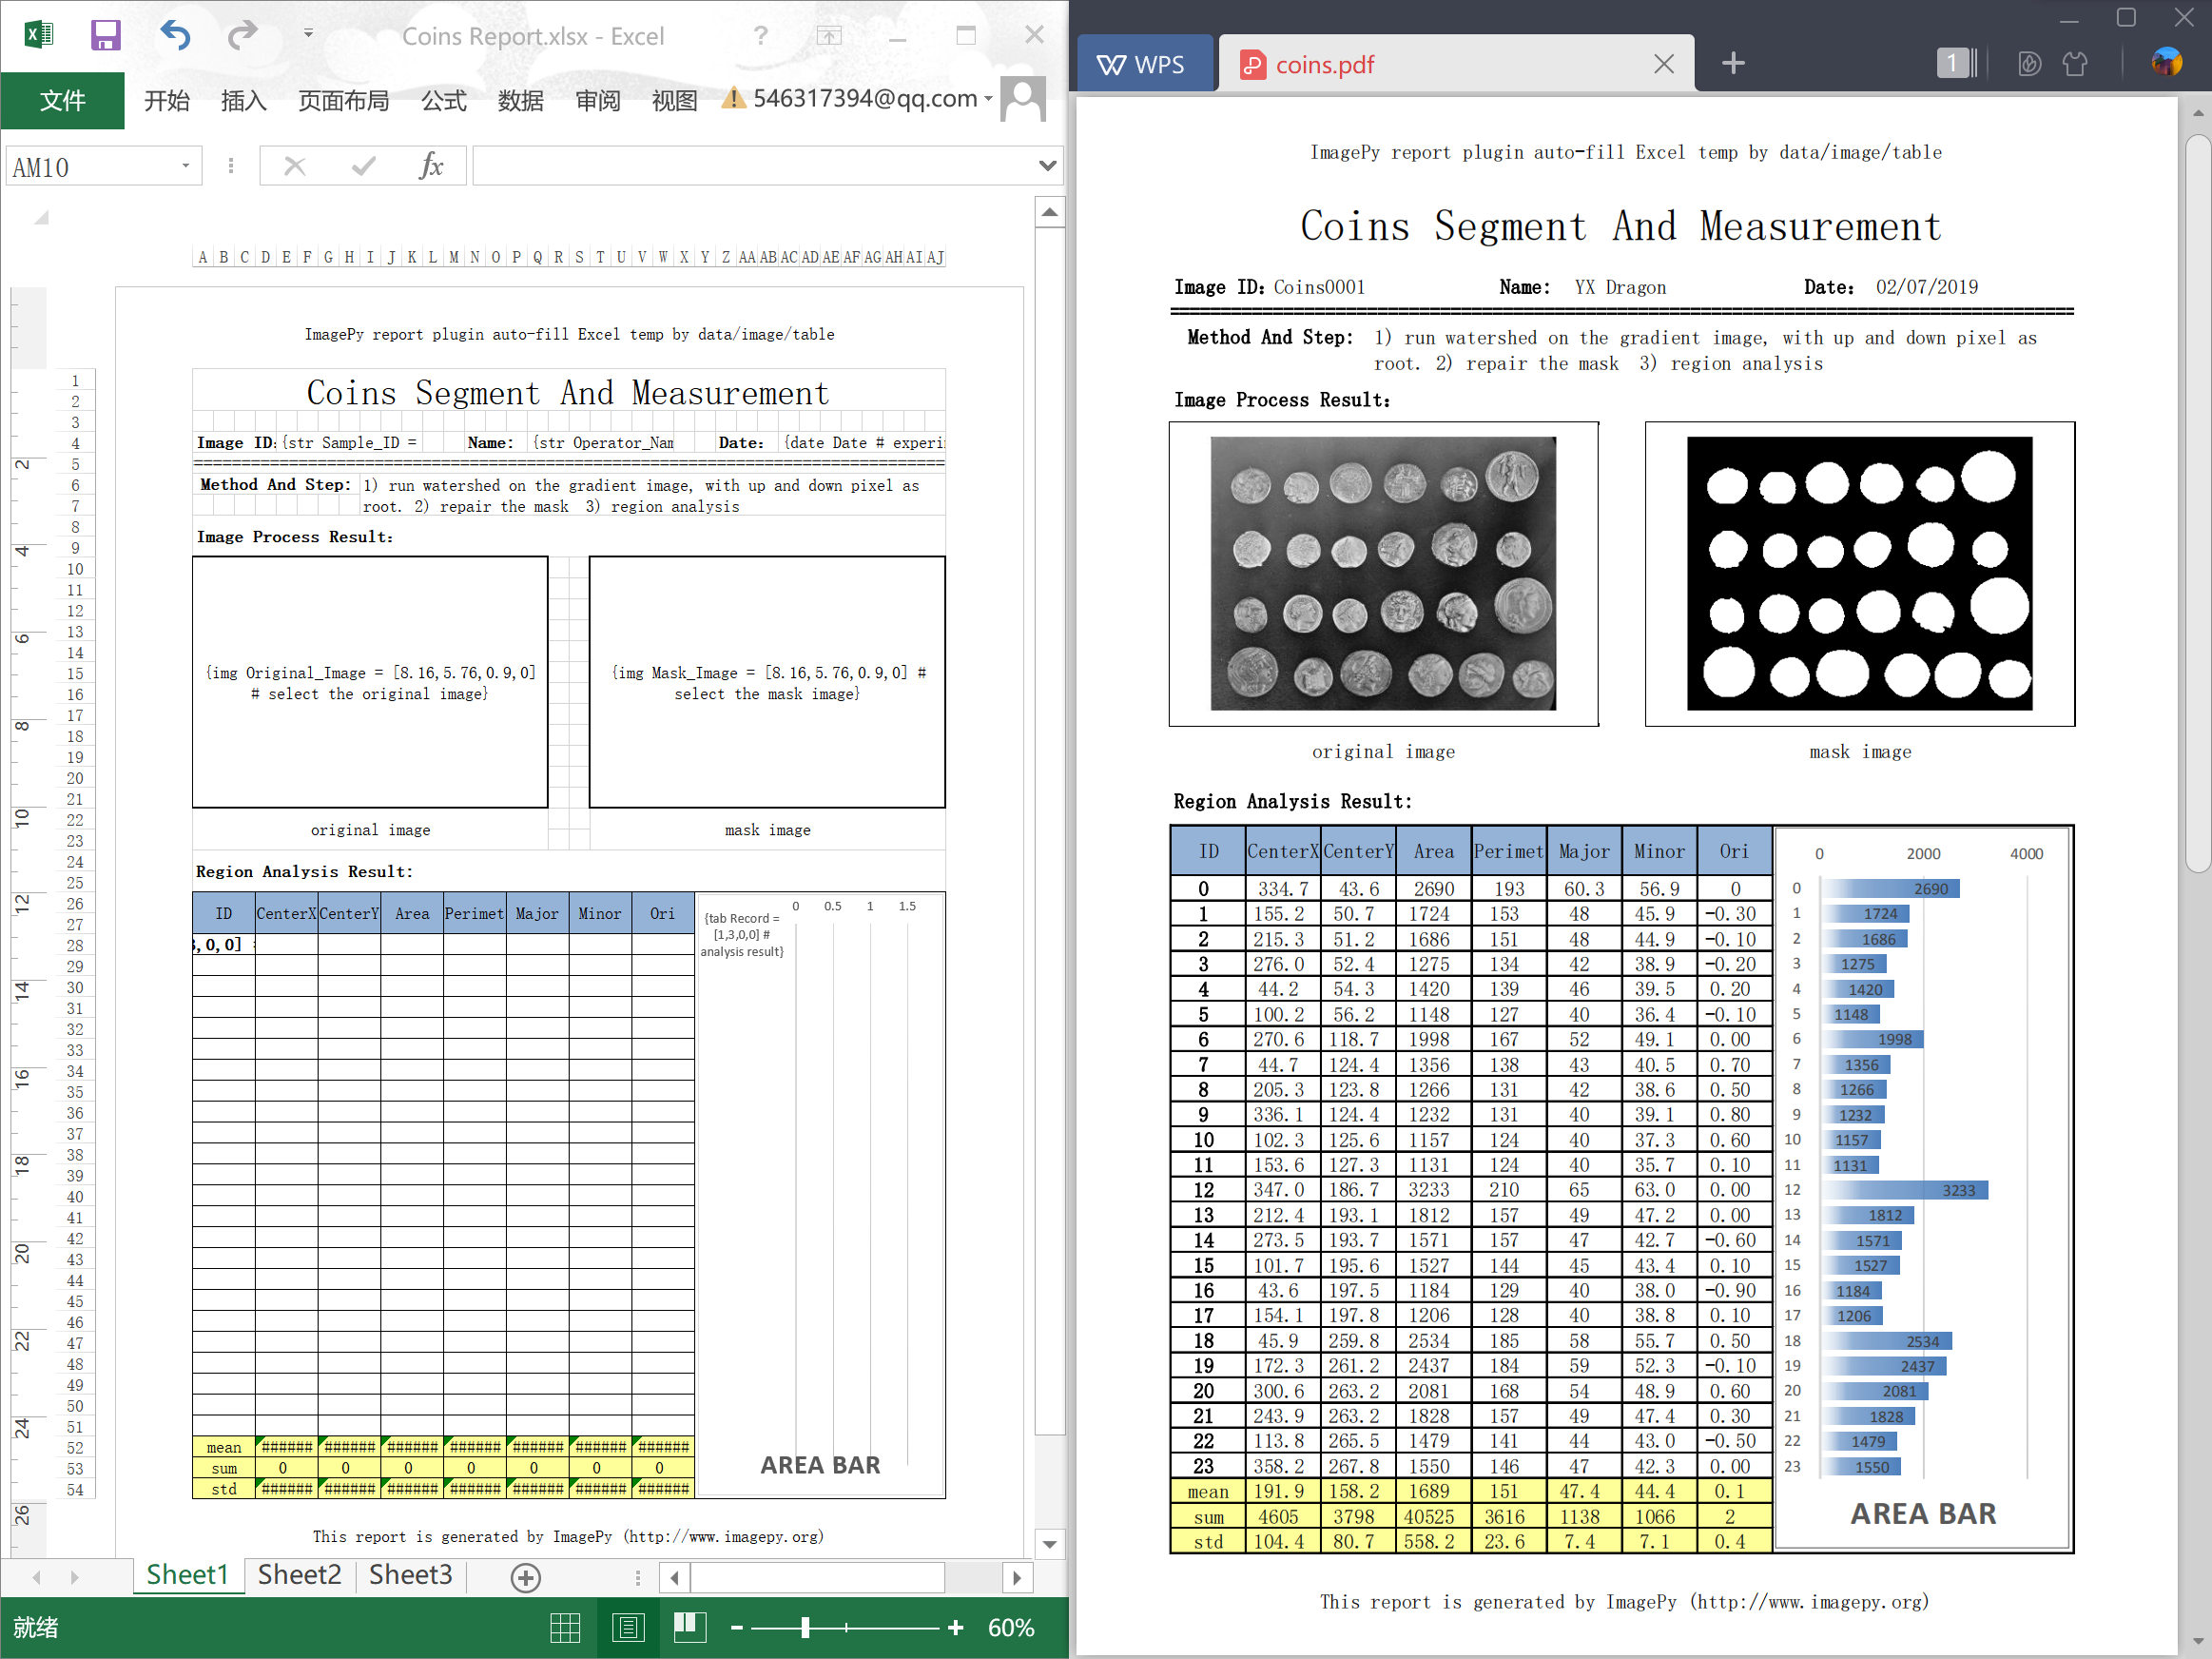
generate report
Filter Plugin
We introduced macros and workflows in the last sections, using macros and workflows to connect existing functions is convenient. But sometimes we need to create new features. In this section, we are trying to add a new feature to ImagePy. ImagePy can easily access any Numpy-based function. Let's take the Canny operator of scikit-image as an example.
from skimage import feature
from imagepy.core.engine import Filter

class Plugin(Filter):
    title = 'Canny'
    note = ['all', 'auto_msk', 'auto_snap', 'preview']
    para = {'sigma':1.0, 'low_threshold':10, 'high_threshold':20}

    view = [(float, 'sigma', (0,10), 1, 'sigma', 'pix'),
            ('slide', 'low_threshold', (0,50), 4, 'low_threshold'),
            ('slide', 'high_threshold', (0,50), 4, 'high_threshold')]

def run(self, ips, snap, img, para = None):
    return feature.canny(snap, para['sigma'], para['low_threshold'],
        para['high_threshold'], mask=ips.get_msk())*255
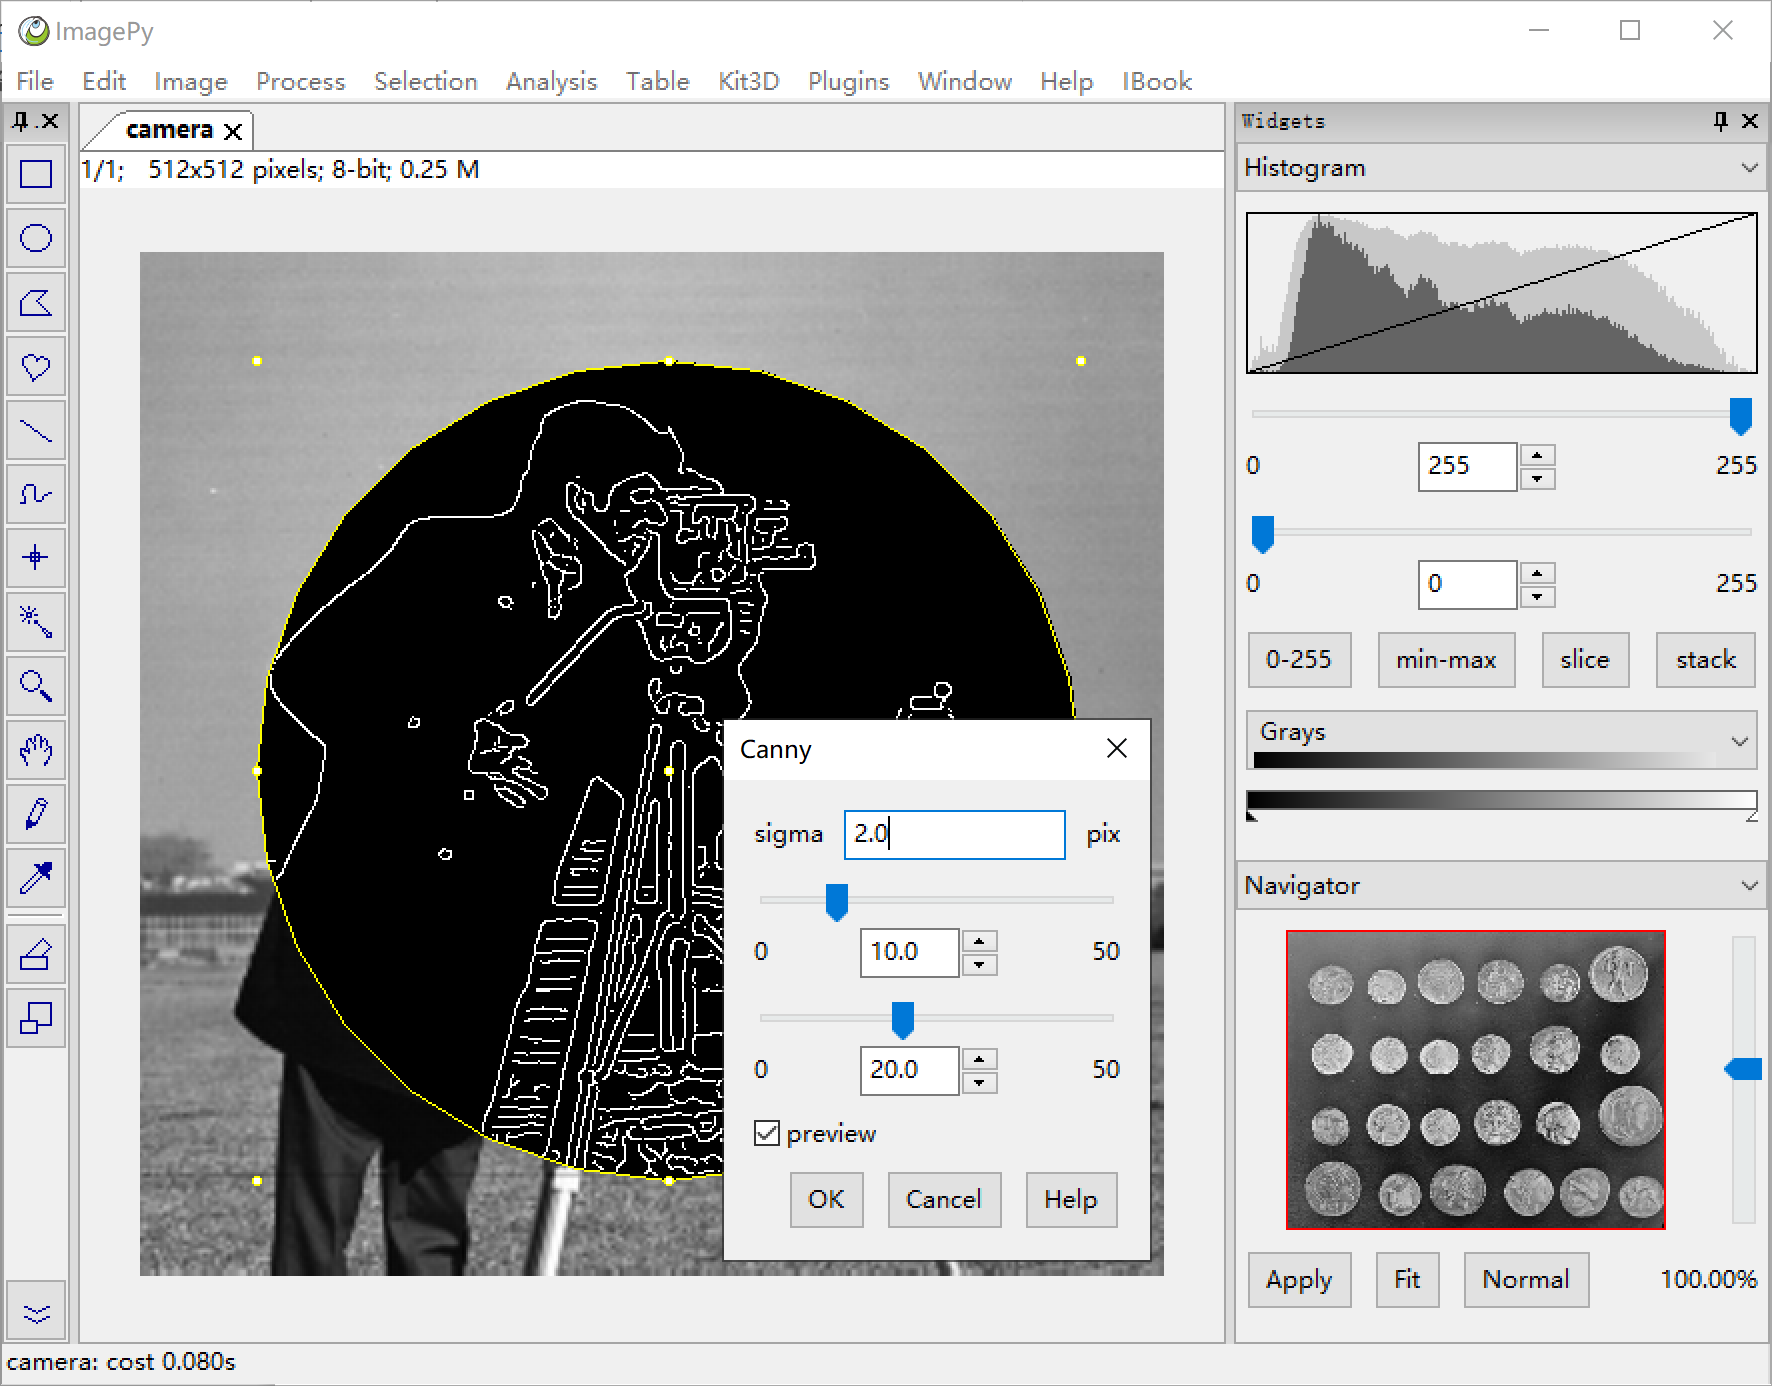
Canny Filter Demo
Steps to create a your own filter:
- Import the package(s), often third party.
- Inherit the
Filterclass。 - The
titlewill be used as the name of the menu and the title of the parameter dialog, also as a command for macro recording. - Tell the framework what needs to do for you in
Note, whether to do type checking, to support the selection, to support UNDO, etc. Parais the a dictionary of parameters, including needed parameters for the functions.- Define the interaction method for each of the parameters in
View, the framework will automatically generate the dialog for parameter tuning by reading these information. - Write the core function
run.imgis the current image,parais the result entre by user. ifauto_snapis set innote,snapwill be a duplicate ofimg. We can process thesnap, store the result inimg. If the function does not support the specified output, we can also return the result, and the framework will help us copy the result to img and display it. - Save the file as
xxx_plg.pyand copy to themenufolde
Core symbols most depended-on inside this repo
appendShape
Languages
Modules by API surface
For agents
$ claude mcp add imagepy \
  -- python -m otcore.mcp_server <graph>