hub / github.com/Gip-Gip/egui-plotter
github.com/Gip-Gip/egui-plotter @main
Chat with this repoBrowse by type
What it actually does AI analysis from the code graph — generated when you open this
loading…
README
egui-plotter



simple to use utilties for integrating plotter into egui
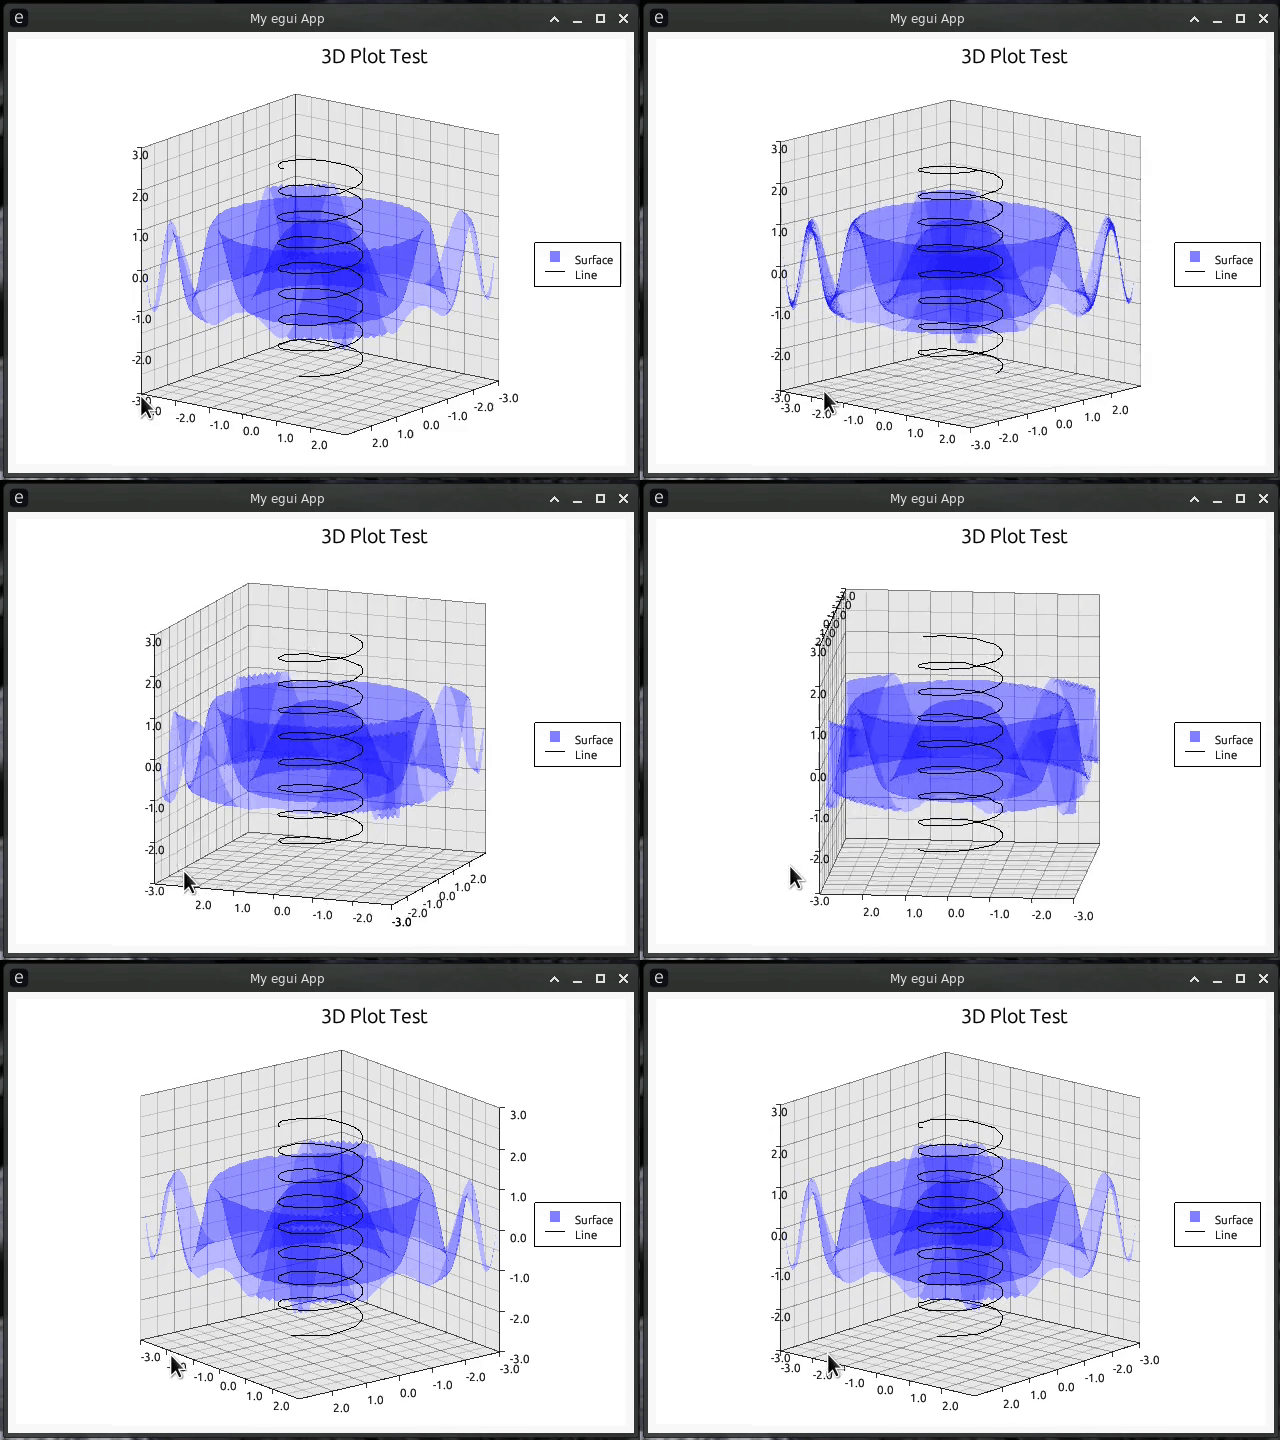
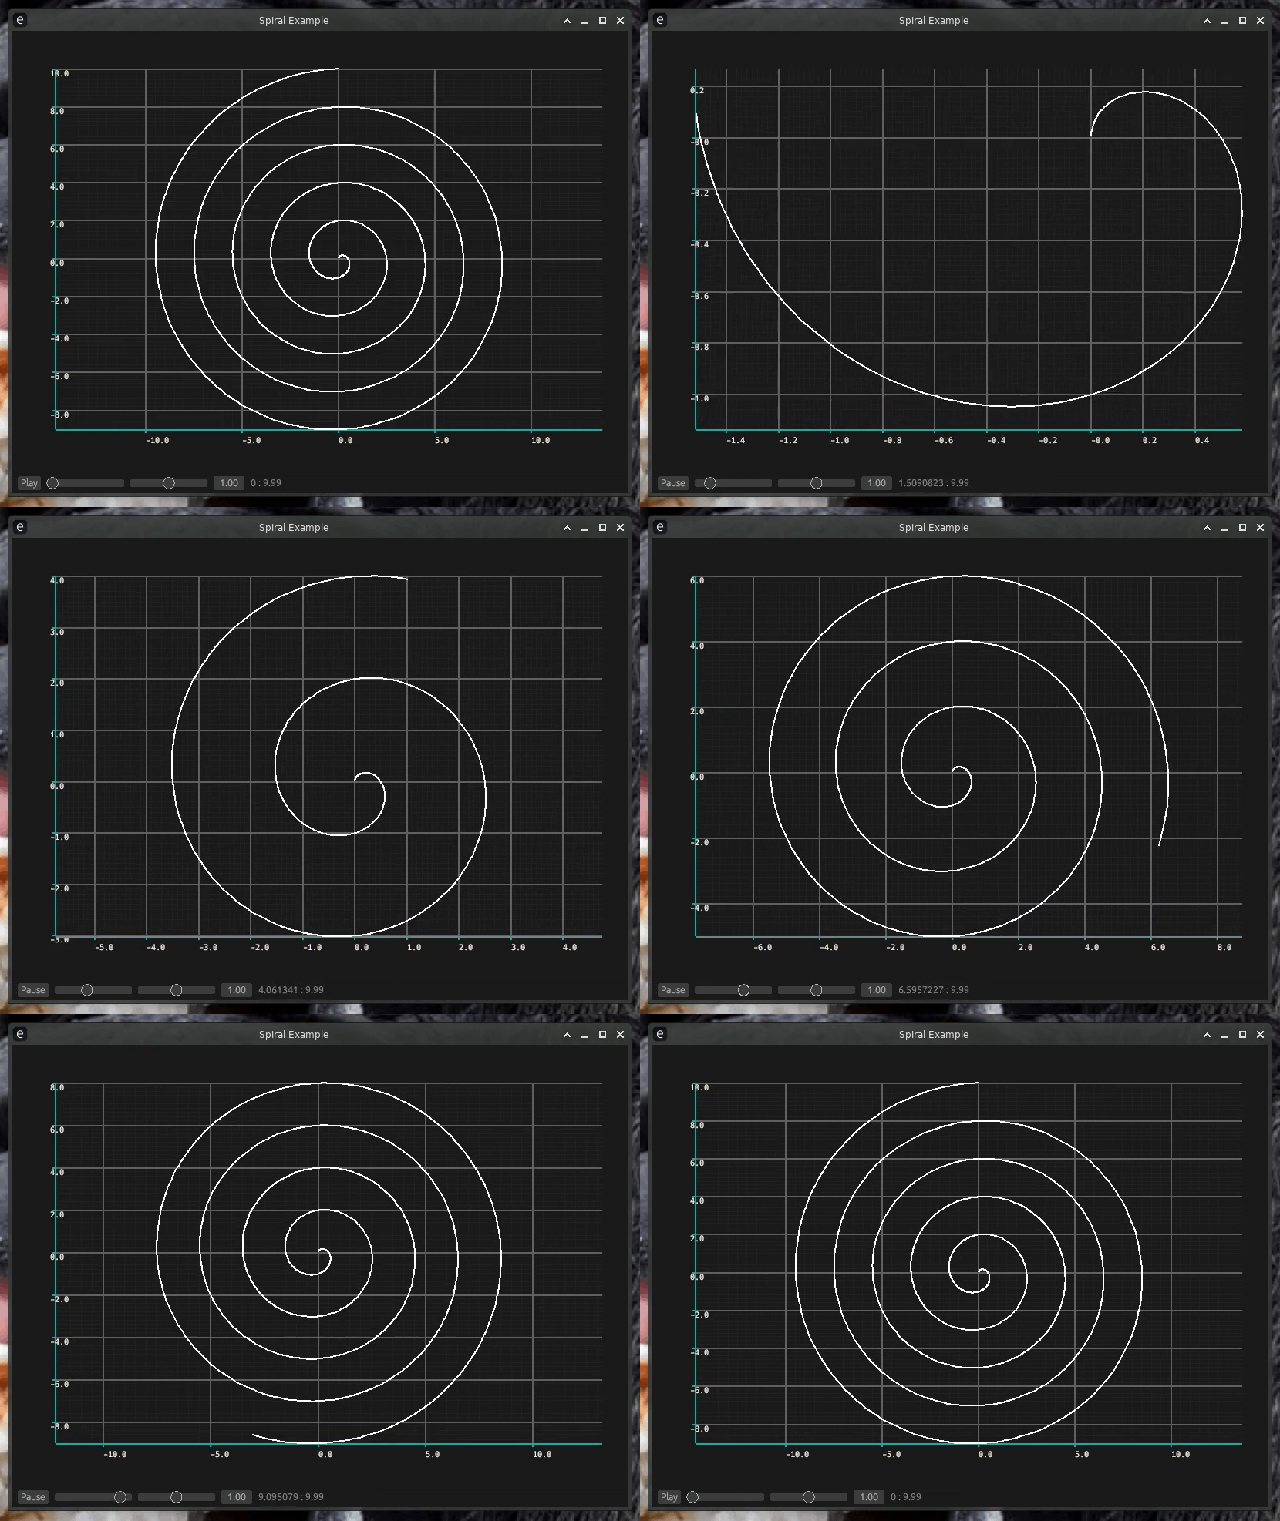
Usage
This crate can be used by adding egui-plotter to the dependencies in your
project's Cargo.toml.
[dependencies]
egui-plotter = "0.6.0"
Features
timechart- Includes all the pre-made animatable charts like XyTimeData and TimeData.
Examples
Here's a simple plotter example being run on native eframe. Derived from eframe and plotters.
use eframe::egui::{self, CentralPanel, Visuals};
use egui_plotter::EguiBackend;
use plotters::prelude::*;

fn main() {
    let native_options = eframe::NativeOptions::default();
    eframe::run_native(
        "Simple Example",
        native_options,
        Box::new(|cc| Ok(Box::new(Simple::new(cc)))),
    )
    .unwrap();
}

struct Simple;

impl Simple {
    fn new(cc: &eframe::CreationContext<'_>) -> Self {
        // Enable light mode
        let context = &cc.egui_ctx;
        context.set_visuals(Visuals::light());

        Self
    }
}

impl eframe::App for Simple {
    fn update(&mut self, ctx: &egui::Context, _frame: &mut eframe::Frame) {
        CentralPanel::default().show(ctx, |ui| {
            let root = EguiBackend::new(ui).into_drawing_area();
            root.fill(&WHITE).unwrap();
            let mut chart = ChartBuilder::on(&root)
                .caption("y=x^2", ("sans-serif", 50).into_font())
                .margin(5)
                .x_label_area_size(30)
                .y_label_area_size(30)
                .build_cartesian_2d(-1f32..1f32, -0.1f32..1f32)
                .unwrap();

            chart.configure_mesh().draw().unwrap();

            chart
                .draw_series(LineSeries::new(
                    (-50..=50).map(|x| x as f32 / 50.0).map(|x| (x, x * x)),
                    &RED,
                ))
                .unwrap()
                .label("y = x^2")
                .legend(|(x, y)| PathElement::new(vec![(x, y), (x + 20, y)], &RED));

            chart
                .configure_series_labels()
                .background_style(&WHITE.mix(0.8))
                .border_style(&BLACK)
                .draw()
                .unwrap();

            root.present().unwrap();
        });
    }
}
Charts
Alternatively, the above example can be made with a Chart type to allow easy
user interactivity with your plotter charts. You can either make your own chart or
use a prebuilt chart type included in the charts module.
use eframe::egui::{self, CentralPanel, Key, Visuals};
use egui_plotter::{Chart, MouseConfig};
use plotters::prelude::*;
use std::ops::Range;

fn main() {
    let native_options = eframe::NativeOptions::default();
    eframe::run_native(
        "ParaChart Example",
        native_options,
        Box::new(|cc| Ok(Box::new(ParaChart::new(cc)))),
    )
    .unwrap();
}

struct ParaChart {
    chart: Chart<(Range<f32>, Range<f32>)>,
}

impl ParaChart {
    fn new(cc: &eframe::CreationContext<'_>) -> Self {
        // Enable light mode
        let context = &cc.egui_ctx;
        context.set_visuals(Visuals::light());

        // We use data to adjust the range of the chart. This can be useful for
        // line plots where the X represents time and we want to play through
        // the X, but that is not what we are using it for here
        let chart = Chart::new((-3f32..3f32, -0.5f32..3f32))
            .mouse(MouseConfig::enabled())
            .builder_cb(Box::new(|area, _t, ranges| {
                // Build a chart like you would in any other plotter chart.
                // The drawing area and ranges are provided by the callback,
                // but otherwise everything else is the same.

                let (x_range, y_range) = ranges;

                let mut chart = ChartBuilder::on(area)
                    .caption("y=x^2", ("sans-serif", 50).into_font())
                    .margin(5)
                    .x_label_area_size(30)
                    .y_label_area_size(30)
                    .build_cartesian_2d(x_range.to_owned(), y_range.to_owned())
                    .unwrap();

                chart.configure_mesh().draw().unwrap();

                chart
                    .draw_series(LineSeries::new(
                        (-50 * (x_range.end as i32)..=(50 * x_range.end as i32))
                            .map(|x| x as f32 / 50.0)
                            .map(|x| (x, x * x)),
                        &RED,
                    ))
                    .unwrap()
                    .label("y = x^2")
                    .legend(|(x, y)| PathElement::new(vec![(x, y), (x + 20, y)], RED));

                chart
                    .configure_series_labels()
                    .background_style(WHITE.mix(0.8))
                    .border_style(BLACK)
                    .draw()
                    .unwrap();
            }));

        Self { chart }
    }
}

impl eframe::App for ParaChart {
    fn update(&mut self, ctx: &egui::Context, _frame: &mut eframe::Frame) {
        CentralPanel::default().show(ctx, |ui| {
            // Press 1 for the range -1..1, 2 for -2..2, 3 for -3..3
            ui.input(|input| {
                if input.key_down(Key::Num1) {
                    *self.chart
                        .get_data_mut() = (-1f32..1f32, -0.5f32..1f32);
                }
                if input.key_down(Key::Num2) {
                    *self.chart
                        .get_data_mut() = (-2f32..2f32, -0.5f32..2f32);
                }

                if input.key_down(Key::Num3) {
                    *self.chart
                        .get_data_mut() = (-3f32..3f32, -0.5f32..3f32);
                }
            });

            self.chart.draw(ui);
        });
    }
}
Core symbols most depended-on inside this repo
Shape
Languages
Rust100%
Modules by API surface
src/backend.rs32 symbols
src/chart.rs31 symbols
src/charts/xytime.rs30 symbols
src/charts/timedata.rs29 symbols
src/lib.rs8 symbols
examples/timechart.rs4 symbols
examples/spiral.rs4 symbols
examples/simple_bg.rs4 symbols
examples/simple.rs4 symbols
examples/parachart.rs4 symbols
examples/3dchart.rs4 symbols
examples/3d.rs4 symbols
For agents
$ claude mcp add egui-plotter \
  -- python -m otcore.mcp_server <graph>