github.com/Christopher-06/rustmeter @v0.2.0
Chat with this repoWhat it actually does AI analysis from the code graph — generated when you open this
README
RustMeter
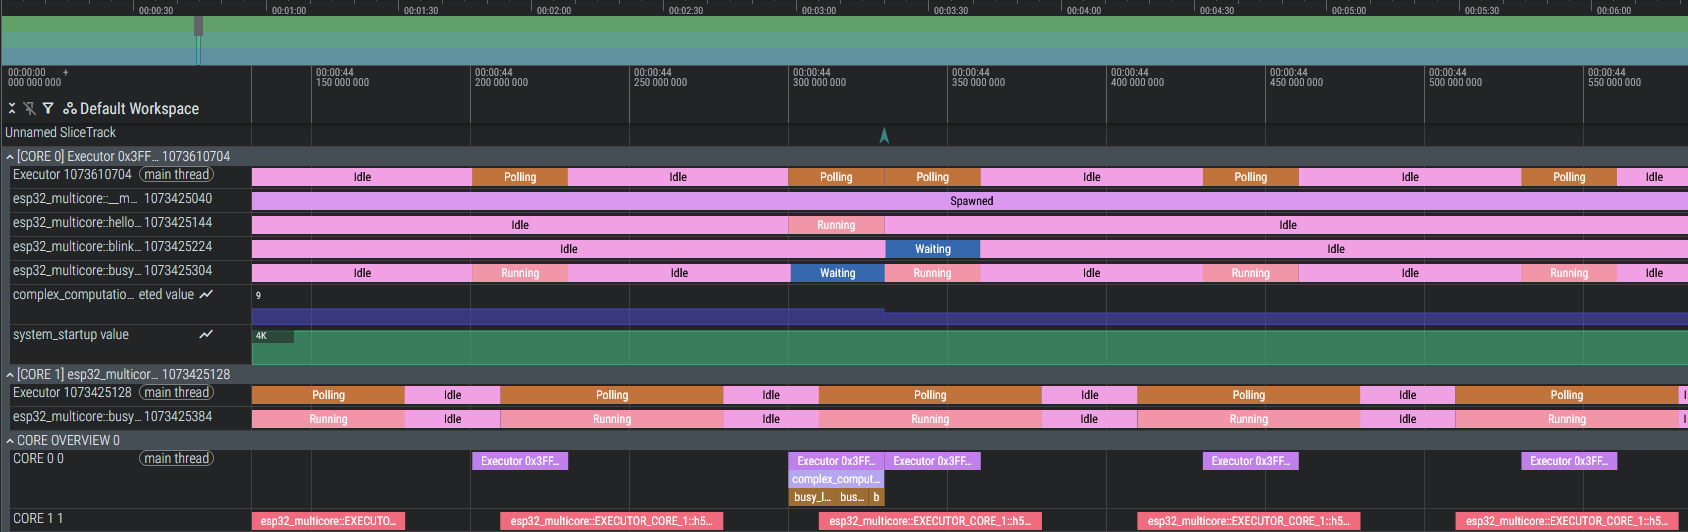
RustMeter is a comprehensive profiling, tracing, and monitoring system designed specifically for Embedded Rust applications. It is highly integrated with the Embassy async framework and defmt logging system. The collected data is converted into a format that can be directly visualized in the Perfetto UI, providing detailed insights into runtime behavior, task scheduling, and firmware performance.
Features
- Embassy Task Tracing: Automatically visualizes the lifecycle of async tasks (Spawned, Waiting, Running, Idle).
- Function Monitoring: Simple macro
#[monitor_fn]to measure execution times of functions and granular measurement of specific code blocks usingmonitor_scoped!. - Custom Metrics: Record values over time (e.g., sensor data, memory usage) using
monitor_value!. - Multicore Support: Detects and visualizes events separated by processor cores (e.g., ESP32 App/Pro CPU).
- Defmt Timestamp: Visualizes defmt log messages in the timeline for better correlation with events (even without defmt timestamp feature!).
Project Structure
The repository consists of two main components:
-
rustmeter-beacon: The library included in your embedded firmware. It provides macros and hooks forembassy-executoranddefmt. -
rustmeter-cli: The command-line tool for the developer PC. It runs the project, collects tracing data, and creates the JSON file for Perfetto.
🚀 Installation & Setup
1. Prepare Embedded Project
Add rustmeter-beacon to your embedded project's Cargo.toml and initialize it in your code. Follow the instructions in the rustmeter-beacon README for detailed setup and usage.
2. Install CLI
Install the host tool locally:
cargo install rustmeter
and run your embedded project with:
rustmeter run --release --chip <YOUR_CHIP>
or adjust your cargo runner in .cargo/config.toml:
[target.XXX-XXX-XXX]
runner = "rustmeter run --chip <YOUR_CHIP>" # Adjust target accordingly
and use cargo run as usual:
cargo run --release
Benchmarking
Any tracing system introduces some overhead. RustMeter is designed to be lightweight, but it's essential to understand its impact on your application. Any measurement or event emitted incurs a small time cost. The future goal is to even lower the following overheads; especially on Cortex-M based MCUs to <1us. RustMeter uses a lock-free ringbuffer per core to fastly enqueue events, which are then sent out via RTT or UART/Serial JTAG in the background. This approach minimizes the blocking time in your application code and allows high-frequency logging; e.q. multiple tasks running each millisecond!
Espressif MCUs have been optimized to cost around 0.4 - 1.2us per event, depending on the clock speed and bus usage (e.q. tested on ESP32 @ 100 Mhz and ESP32-S3 @ 240 Mhz).
Cortex-M based MCUs like STM32 and RP2040 currently have a higher overhead of around 1 - 8us per event due to lower frequencies, the lack of optimized atomic operations and cache mechanisms. Further optimizations are planned in future releases (e.q. tested on STM32F446 @ 80 Mhz and RP2040 @ 100 Mhz).
All measured times then include not only the actual event time, but also this overhead, which determines the accuracy of rustmeter. So any instrumentation should be used judiciously in performance-critical sections. However, for many applications, the overhead is negligible compared to the insights gained from detailed profiling. Any measurement value
Troubleshooting
- Deadlock Debugging: If you encounter a deadlock in your code and the printing task was started on the same core, the trace may not show the last events because the printing task is blocked as well. To avoid this, create a dedicated interrupt executor with a higher priority and initialize rustmeter-beacon with this executor.
- Missing Embassy Events: If certain events are not appearing in the trace, ensure that the
tracefeature is enabled forembassy-executorin your Cargo.toml. - Performance Issues: While RustMeter is designed to be lightweight, excessive instrumentation may impact performance. Use monitoring macros judiciously in performance-critical sections.
- No Data in Perfetto: If the generated JSON file does not contain expected data, verify that your embedded application is running and generating events during the tracing session. Try some basic instrumentation first to confirm functionality like
#[monitor_fn]on a simple function and logging viadefmt. Ensure that you are not using incompatible crates likeesp-printlnorrtt-targetwhich interfere communication.
🤝 License
This project is licensed under the MIT License. See LICENCE for details.
Roadmap
- [ ] Add more examples, tests and documentation
- [ ] Support NRF chips
- [ ] Include RTOS Tracing suport (ESP-RTOS)
- [ ] Implement advanced analysis (CPU usage, max waiting time, task jitter, etc.)
- [ ] Optimize performance and reduce overhead further
- [ ] Introduce an optional ruling file to enforce specific monitoring rules (e.q. value constraints, critical waiting time, critical CPU usage)
- [ ] Leverage the bidirectional communication to user requests like dynamic enabling/disabling of monitoring points or setting value thresholds and flags
Note: This tool is still under heavy development. APIs are subject to change.
Extension points exported contracts — how you extend this code
ChipMonitoringTool (Interface)Core symbols most depended-on inside this repo
iterShape
Languages
Modules by API surface
For agents
$ claude mcp add rustmeter \
  -- python -m otcore.mcp_server <graph>